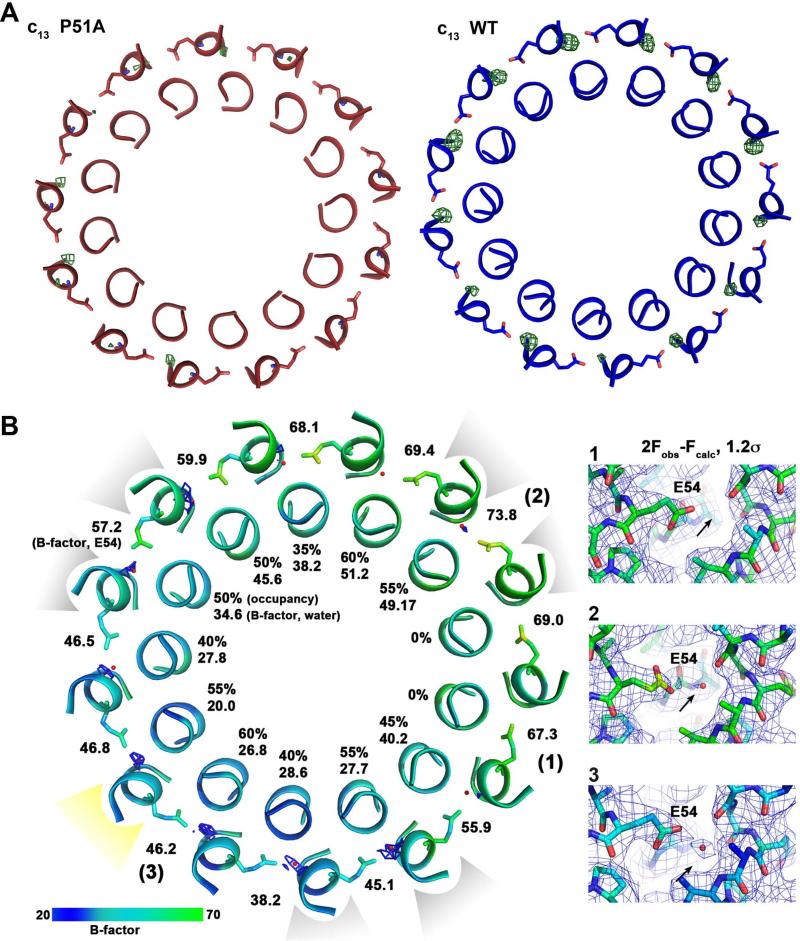
Figure 6. Analysis of the water occupancies in the WT and P51A mutant B. pseudofirmus c13 ring ion-binding sites.
(A) The slate view is from the cytoplasm on the WT (blue) and P51A mutant (red) c13 ring at the level of the ion-binding sites. The helices are shown in ribbon representation, E54 as sticks. Omit map (Fobs-Fcalc, displayed at 3.5σ of the water molecules within the site is shown as green mesh. While in the WT c-ring all binding sites show strong densities, corresponding to 100% occupancy of the water molecules, just a few binding sites contain mostly weak densities for the waters, with lower occupancies in the P51A mutant. This indicates either absence or a higher flexibility of water molecules at these positions. (B) Slate view from cytoplasm on the P51A c-ring at level of the E54. The 2Fobs-Fcalc maps at 1.2σ show only partial water occupancy within the sites. The contact positions of crystallographic c-ring symmetry mates are indicated in light grey: three contacts at the cytoplasmic c-ring side (loop) and yellow: one contact at the periplasmic c-ring side (N- and C-termini). The water occupancies at c-subunits involved in crystal contacts are slightly higher. Water occupancies and B-factors are given for each individual water molecule. The B-factors for E54 side chains are also indicated. [1], [2] and [3]: Three examples for 2Fobs-Fcalc electron density maps shown at 1.2σ as grey mesh. Colors: A B-factor color scale from low (blue) to high (green) is indicated. The arrow points to the expected position of the water molecule.

