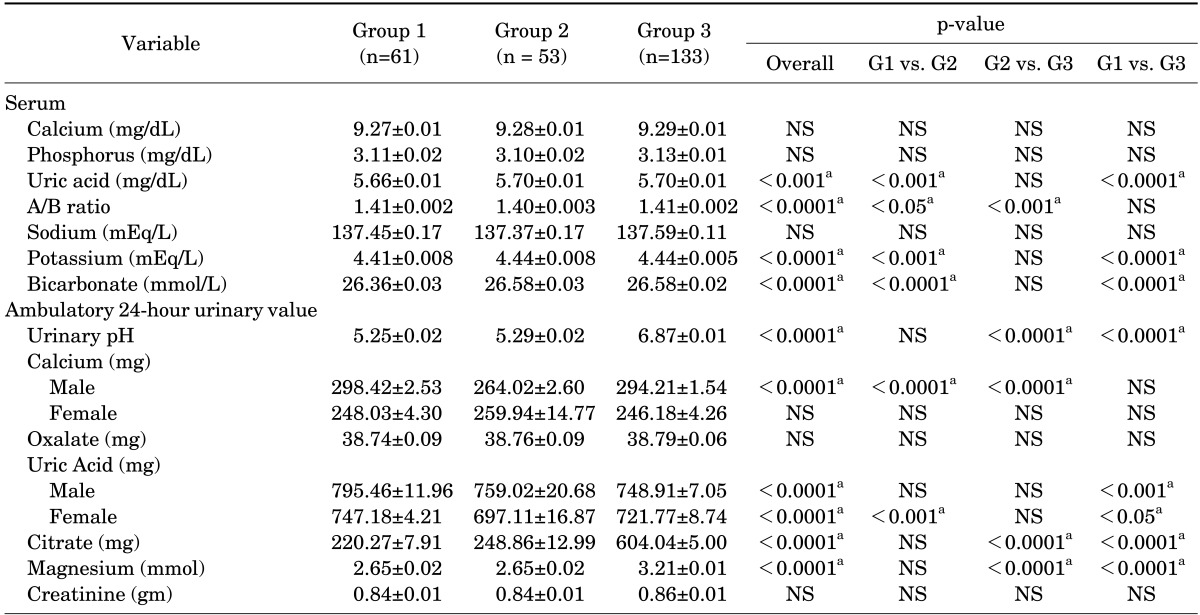
TABLE 2.
Comparison of treatment values of serum and 24-hour urinary variables in three groups (result of ANCOVA)

Values are presented as mean±standard error.
ANCOVA, analysis of covariance; NS, not significant.
a:Significant.
Comparison of treatment values of serum and 24-hour urinary variables in three groups (result of ANCOVA)

Values are presented as mean±standard error.
ANCOVA, analysis of covariance; NS, not significant.
a:Significant.