
Figure 1.
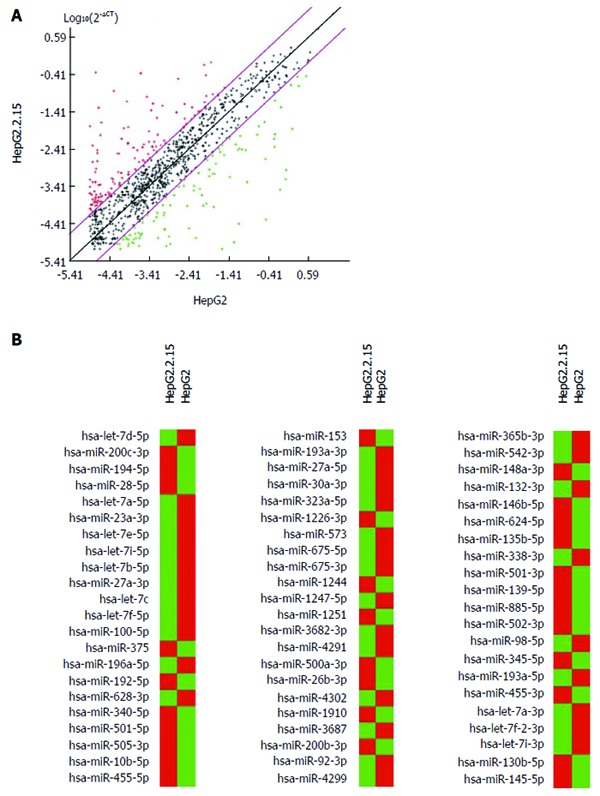
MicroRNAs expression in hepatoma cells HepG2.2.15 and HepG2. A: Scatter plots of 1008 miRNAs indicate 2-dCT numerical values in HepG2 cells (x-axis) and HepG2.2.15 cells (y-axis). The black line indicates fold changes of 1. The pink lines indicate 5-fold change in miRNA expression threshold, comparing HepG2.2.15 with HepG2. Red + indicates miRNA expressed at least 5-fold higher in HepG2.2.15 than in HepG2 cells. Green + indicates miRNA expressed at least 5-fold lower in HepG2.2.15 than in HepG2 cells. Black + indicates that the difference of miRNA between the two cells was within 5-fold; B: Comparison of miRNAs expression between HepG2 and HepG2.2.15 cells. Red color indicates miRNA expressed at least 5-fold higher in HepG2.2.15 than in HepG2 cells. Green color indicates miRNA expressed at least 5-fold lower in HepG2.2.15 than in HepG2 cells. miRNAs: MicroRNAs.