
Figure 3.
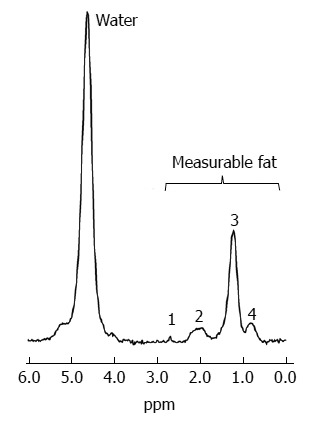
Magnetic resonance spectroscopy spectrum of hepatic fat. Water and fat peaks are displayed at different frequencies; water appears as a single peak at 4.7 ppm, whereas fat appears as four peaks, including the dominant methylene (CH2) peak at 1.3 ppm (3), a methyl (CH3) peat at 0.9 ppm (4), an α-olefinic and α-carboxyl peak at 2.1 ppm (2), and a diacyl peak at 2.75 ppm (1); the areas of these four fat peaks and the water peak can be measured by spectral tracing. Proton density fat fraction can be calculated as (sum of fat peaks) ÷ (sum of fat peaks + water peak)[45,82].