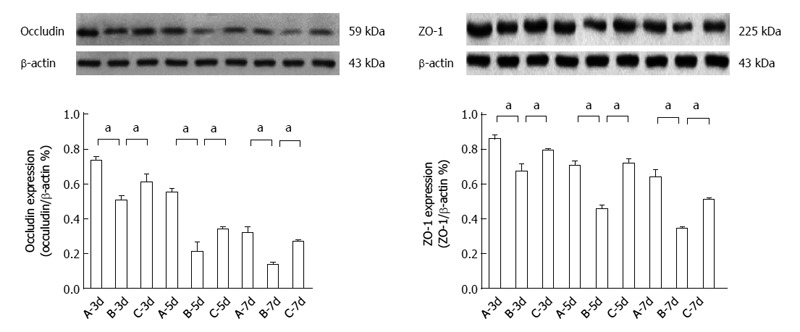
Figure 4.

Occludin and zona occludens-1 protein expression after heterotopic intestinal transplantation. Occludin and zona occludens (ZO)-1 protein expression was significantly lower in group B than in group A (aP < 0.05 vs group B at day 5: 0.2082 ± 0.0582 vs 0.5477 ± 0.0284; aP < 0.05 vs group B at day 7: 0.3415 ± 0.0128 vs 0.6387 ± 0.046). Occludin and ZO-1 protein expression was significantly higher in group C than in group B (aP < 0.05 vs group B at day 7: 0.2674 ± 0.0128 vs 0.1352 ± 0.0142; aP < 0.05 vs group B at day 5: 0.7189 ± 0.0289 vs 0.4556 ± 0.0242). A: Group A (non-rejection); B: Group B (rejection); C: Group C (bone marrow mesenchymal stem cells therapy). β-actin was used as the loading control. Values shown are the mean ± SD.
