
Figure 3.
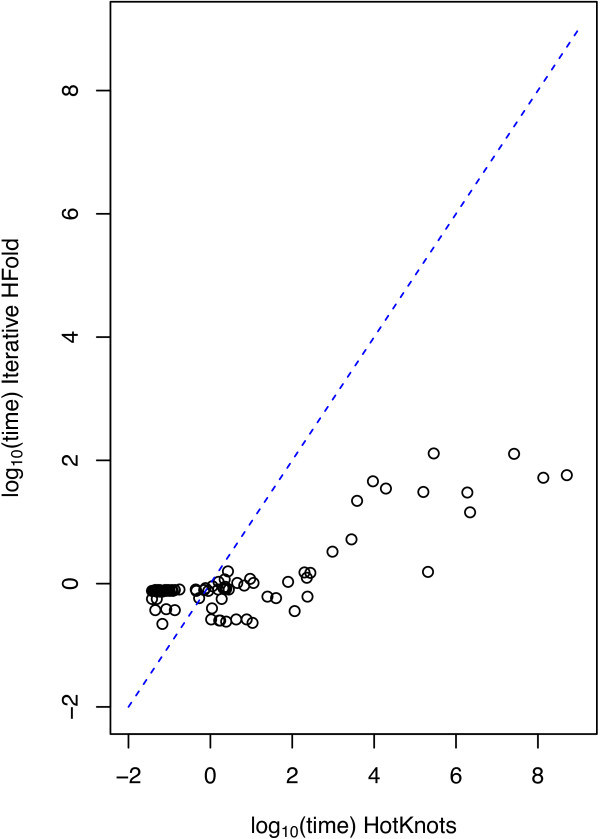
Time comparison. Comparison of running times of Iterative HFold and HotKnots in a log plot. The X axis shows log10(time) for HotKnots data points and the Y axis shows log10(time) for Iterative HFold. Time is measured in seconds.
Official websites use .gov
A
.gov website belongs to an official
government organization in the United States.
Secure .gov websites use HTTPS
A lock (
) or https:// means you've safely
connected to the .gov website. Share sensitive
information only on official, secure websites.
Time comparison. Comparison of running times of Iterative HFold and HotKnots in a log plot. The X axis shows log10(time) for HotKnots data points and the Y axis shows log10(time) for Iterative HFold. Time is measured in seconds.