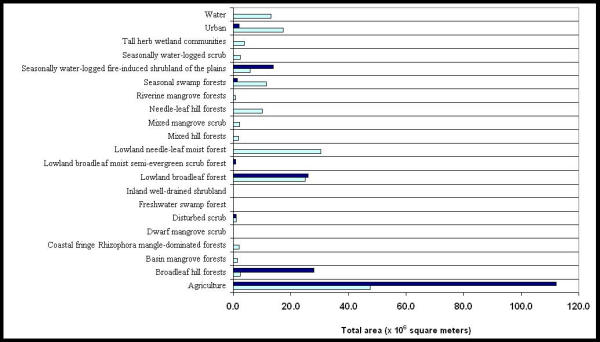
Figure 7.

Total area, in square meters, of vegetation within 2 kilometer buffers around the higher and lower 10 percentile malaria incidence villages. The dark and light blue bars represent the higher and lower 10 percentile malaria incidence rates, respectively
