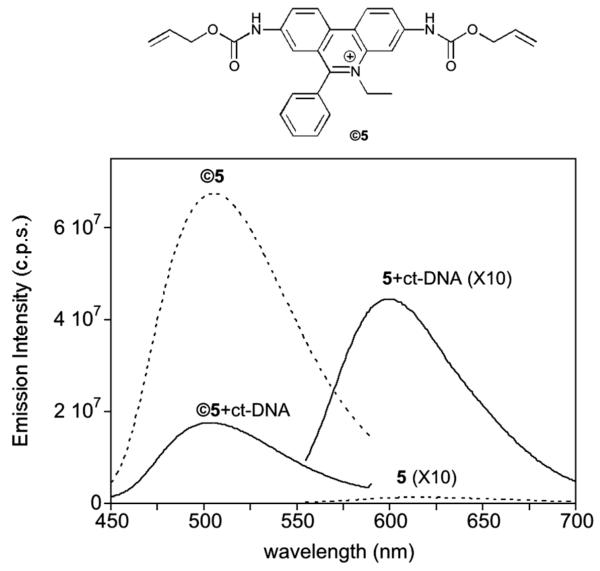
Fig. 5.
Top: Structure of ©5. Bottom: fluorescence emission spectra of 1 μM 5 and ©5 (dashed lines), and spectra of both compounds in the presence of 0.3 mg mL −1 of ct-DNA (solid lines). Spectra of 5 and of 5 in the presence of ct-DNA are represented multiplied by a factor of 10 for comparison. λexc 5 = 545 nm, λexc ©5 = 300 nm.

