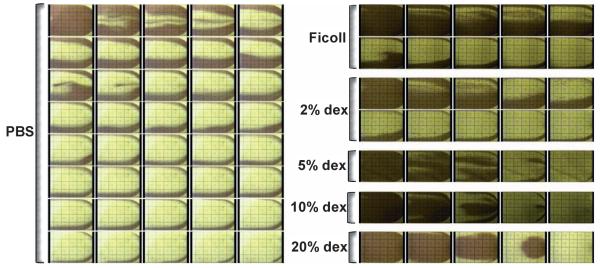
Fig. 4.
Time lapse images showing the flow profile in microfluidic channels of 50 mm × 4 mm × 50 μm when various rinsing buffers were flowed into blood-filled channels at a flow rate of 5 mL/min. The images were taken every 10 seconds near the device outlets. The dark color in the images represents blood cells remaining in the channels while the clear area results from buffer displacement. As the viscosity of the rinsing buffer increases, the time decreases to displace all the blood cells out of the channel.

