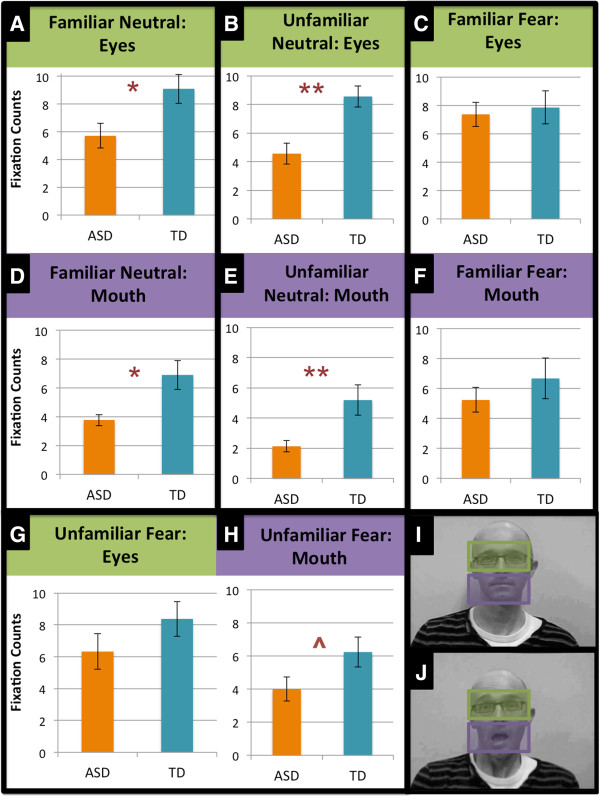
Figure 3.

Fixation counts (100 ms visual attention) for the facial expressions, in each condition and face area. Bar totals represent a mean fixation count across trials. A)/B) The typically developing (TD) group looked longer at the eye region of familiar and unfamiliar people with a neutral expression than the autism spectrum disorder (ASD) group. C)/G) However, the groups were no different in visual attention to the eye region of familiar and unfamiliar people with a fearful expression. D)/E) Likewise, the TD group looked longer than the ASD group to the mouth region of familiar and unfamiliar people with a neutral expression. F)/H) Similarly, the groups were no different in visual attention to the mouth region of familiar people with a fearful expression, though the groups were marginally different on visual attention to the mouth region of unfamiliar people with a fearful expression, with the TD group looking longer than the ASD group. I)/J) Mouth and eye region areas of interest (AOIs). ^P < .10, *P < .05, **P < .01. e
