
Figure 5.
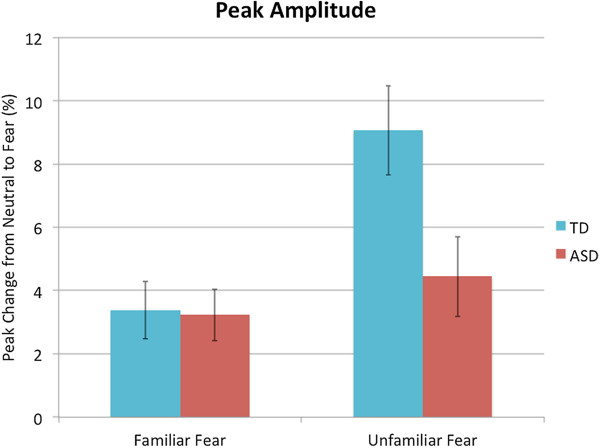
Peak change in pupil diameter from neutral expression to fear expression (shown as a percentage). Unadjusted means for each familiarity condition is pictured here, for each group. Error bars represent standard error.
Official websites use .gov
A
.gov website belongs to an official
government organization in the United States.
Secure .gov websites use HTTPS
A lock (
) or https:// means you've safely
connected to the .gov website. Share sensitive
information only on official, secure websites.
Peak change in pupil diameter from neutral expression to fear expression (shown as a percentage). Unadjusted means for each familiarity condition is pictured here, for each group. Error bars represent standard error.