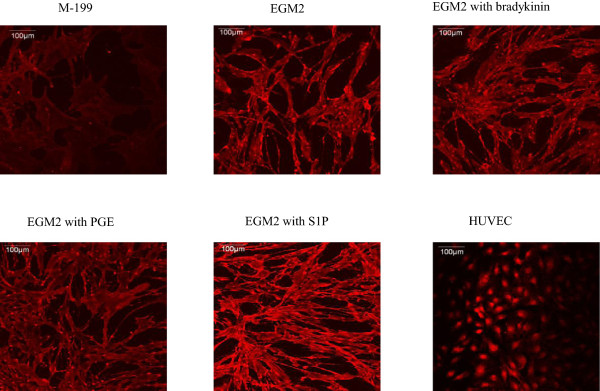
Figure 3.

Immunostaining for eNOS in six different experimental groups. Cells were grown in M-199, EGM2, EGM2 + bradykinin treatment, EGM2 + PGE treatment, EGM2 + S1P. Red fluorescent staining shows the localization of eNOS. ASCs grown in M-199 served as an undifferentiated negative control and HUVEC served as positive controls. Cells treated with S1P show greater red fluorescence intensity compared to the other groups.
