Figure 7.

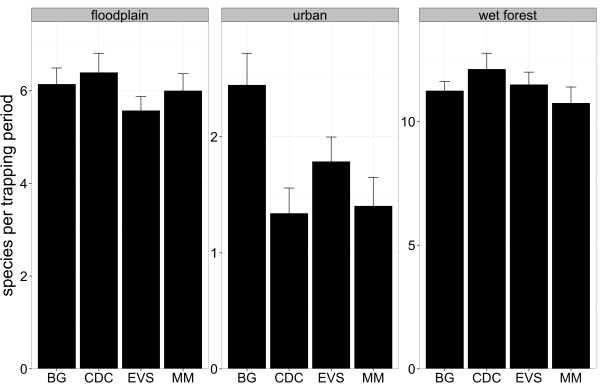
Number of species among the four trapping devices and aggregated biotopes. Mean +/-SE number of trapped species per trapping period among the four trapping devices and the three aggregated biotopes.

Number of species among the four trapping devices and aggregated biotopes. Mean +/-SE number of trapped species per trapping period among the four trapping devices and the three aggregated biotopes.