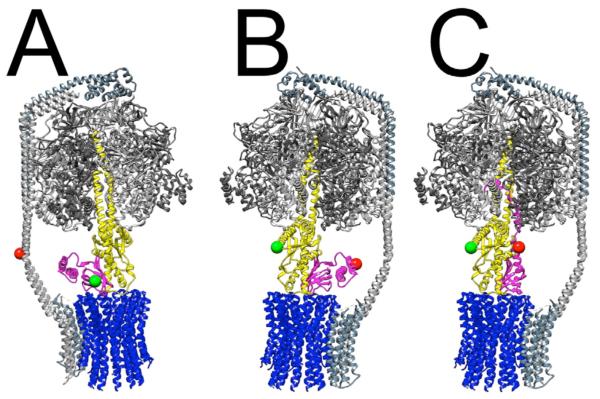
Figure 1. E. coli FoF1-ATP synthase architecture, and cysteine positions for smFRET to monitor rotary subunit movements and ε conformational changes.
Stator subunits are shown in shades of gray (α3β3-δ in F1, ab2 in Fo), and rotor subunits are colored blue (c-ring of Fo), yellow (γ) and magenta (ε). Colored balls mark the locations of engineered cysteines used for labeling with donor (green) or acceptor (red) dyes for smFRET experiments. A: Donor site is ε56, acceptor is b64. During ATP-driven or proton-driven rotation, the labeled ε subunit (i.e. the green ball) stopped at rotary angles in 120° steps so that three distinct distances to the reference position on the b subunits (red ball) were found[42]. B and C: View is rotated 180 °; donor site is γ108, acceptor is ε99. The overall FoF1 architecture shown is from a homology-modeled assembly[60]. In all panels, the α3β3γ complex is from the crystallographic structure[44]. The compact conformation (‘down’) of ε is shown in A and B (structure of isolated ε[61]), and the extended, inhibitory conformation (‘up’) of ε is shown in C, as observed in E. coli F1 [44].

