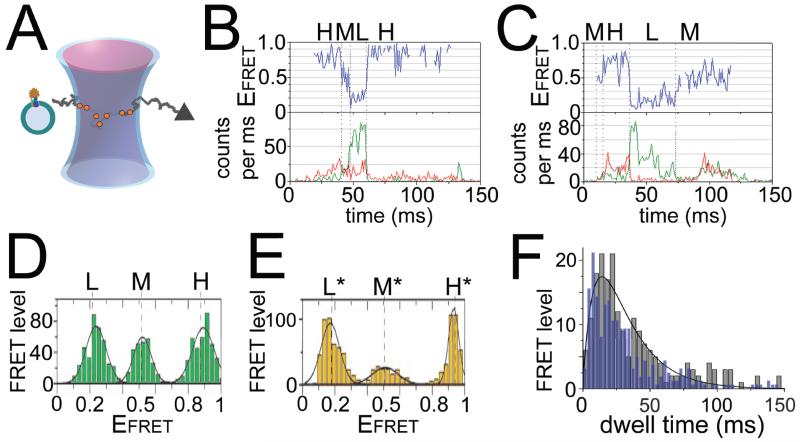
Figure 2. Single-molecule FRET of ε rotation in FoF1-ATP synthase.
A: Alternating laser excitation scheme for confocal smFRET of freely diffusing FoF1-ATP synthase in a liposome. B, C: Photon bursts of single FRET-labeled FoF1, with FRET donor intensities as green traces (donor attached to ε56) and FRET acceptor as red traces (acceptor attached to b64, see Fig. 1A) in the lower panels, and FRET efficiency trajectories as blue traces in upper panels, for ATP hydrolysis (B) or ATP synthesis (C) conditions. H, M, L denote FRET level (see text). D, E: FRET level histograms in the presence of 1 mM Mg2+ATP (D) or 1 mM Mg2+ADP plus 3 mM Pi without PMF (E). H, L, M are the same FRET levels as shown in (B), but H*, L* and M* are different FRET levels. For a visual scheme of these positions in FoF1 see Fig. 7 in[35]. F: Dwell time distribution of ε rotation during ATP hydrolysis as in (B) (blue bars, normalized, 3 ms bins), and in the presence of 20 μm aurovertin (grey bars, 5 ms bins, with fit as black curve)[51]. Figures are reproduced with permissions (B–E from[35], F from[51]).

