
Figure 4.
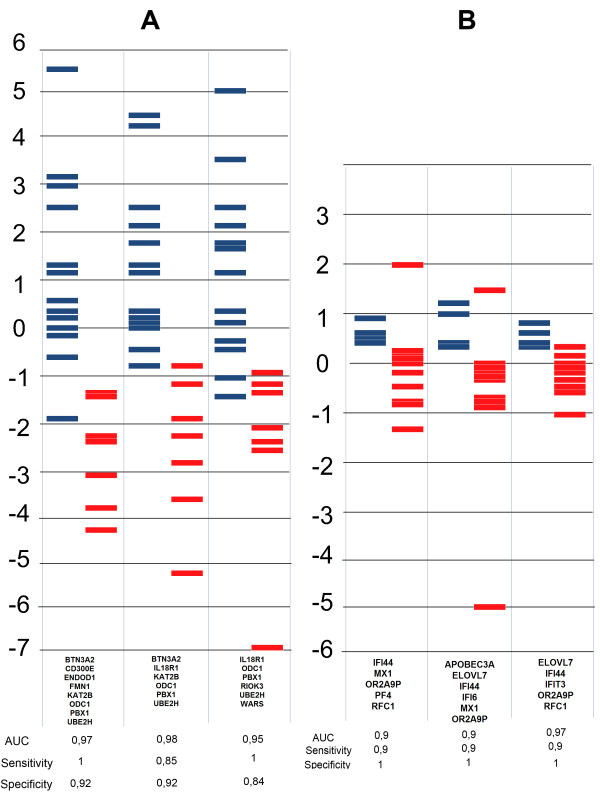
Biostatistical analysis of gene expression data. Three gene lists scored by linear discriminant analysisin (A) Crohn's disease and (B) rheumatoid arthritis. Red bars represent non-responders; blue bars represent responders. The larger the distance between the groups and the smaller the overlap between samples, the higher the power of separation of the gene list.