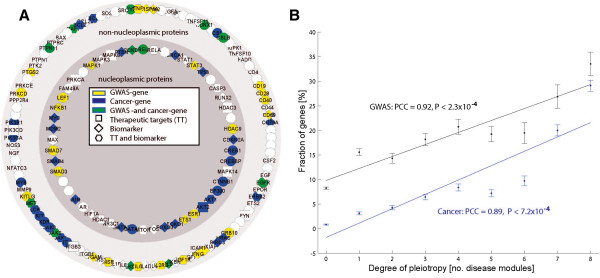
Figure 2.

The pleiotropic module was enriched for GWAS genes, cancer genes, as well as therapeutic targets and biomarkers. (A) Schematic representation of the pleiotropic module. The inner circle represents nucleoplasmic genes and the outer non-nucleoplasmic genes according to Gene Ontology. Therapeutic targets are marked with squares, biomarkers with tilted squares, and hexagons represent both. Node colors code for GWAS genes (yellow), cancer genes (blue), both (green). For clarity we do not show the 7,144 interactions between the pleiotropic module genes. (B) Strongly positive correlations were found between the fraction of GWAS genes and cancer genes in the modules versus the number of disease modules. PCC, Pearson's correlation coefficient.
