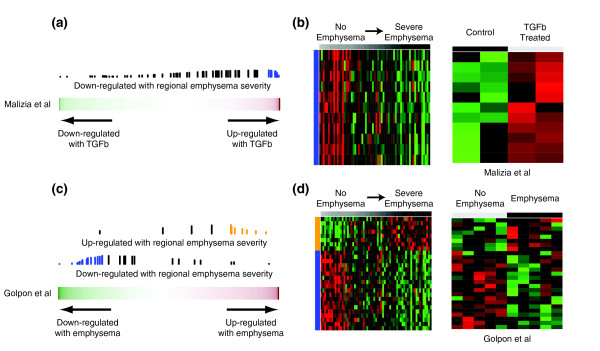
Figure 4.

Relation between gene expression changes associated with regional emphysema severity (Lm) and other gene-expression studies by GSEA. (a) Relation between gene expression changes associated with regional emphysema severity and those induced by TGFβ treatment of A549 cells from Malizia et al.[23]. The color bar represents the fold change between the cell lines treated with and without TGFβ1for 11,910 genes in Malizia et al.[23]. Red indicates a more positive fold change and green indicates a more negative fold change (induced or repressed with TGFβ, respectively). The vertical lines represent the position of genes associated with regional emphysema severity in the ranked gene list. The height of the vertical lines corresponds to the magnitude of the running enrichment score from GSEA. Blue vertical lines indicate that the gene is part of the 'core' enrichment (that is, all the genes from the absolute maximum enrichment score to the end of the ranking). (b) Supervised heatmaps of relative gene expression levels for the core enrichment genes in both the regional emphysema and Malizia et al. datasets (11 genes down-regulated with emphysema severity but up-regulated with TGFβ). Each gene is represented in the same row across heatmaps. (c) Genes changing in expression with increasing regional emphysema severity were enriched in the cross-sectional study of COPD-related gene expression from Golpon et al.[6]. The color bar represents the t-statistic from a t-test between five emphysema patients and five non-smokers for 5,209 genes in Golpon et al.[6]. Blue and orange vertical lines indicate that the gene is part of the core enrichment. (d) Supervised heatmaps of relative gene expression levels for the core enrichment genes in both the regional emphysema and Golpon datasets (8 genes concordantly up-regulated; 19 genes concordantly down-regulated).
