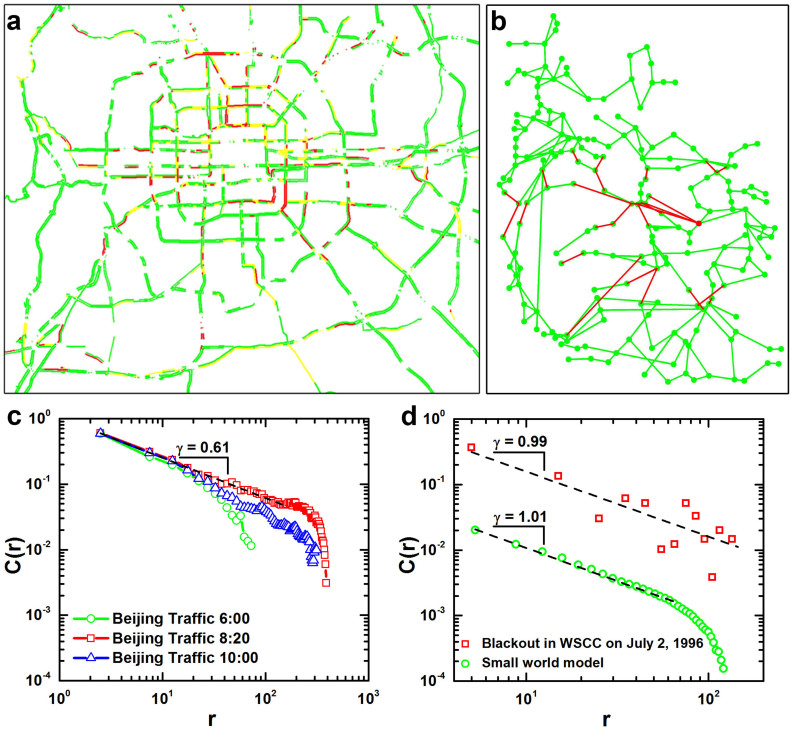
Figure 1. Spatial correlation of cascading failures in real data.
(a) Spatial pattern of cascading failures in traffic in Beijing, at 8:10 on 25th September 2013. Congested roads are in red (e.g. expressways with speed lower than 20 kilometers per hour), functional roads with higher speed are marked in yellow or green, depending on their velocities. More details are presented in Supplementary Information. (b) Spatial pattern of cascading failures in power grid (failures are red nodes and links; functional components are marked in green). This blackout occurred in the Western Systems Coordinating Council on 2nd July 1996. More details are presented in Supplementary Information. (c) Spatial correlation of cascading failures in city traffic for different instants. Power law spatial correlation is found at rush hour (8:20), while correlations decay faster at off-peak hours. Resolution of network distance r for congestion data is around 50 meters in geographical distance. Results from 30 days in April, May, September, October and November in 2013 are averaged here. (d) Spatial correlation of cascading failures (red dots) during blackouts in power grid, where similar spatial correlation is found in the model (green dots) of cascading failures in small-world network (rewiring probability is 0.002). Resolution of network distance r for blackout data is around 5 kilometers in geographical distance. Result in small world model (averaged over 50 realizations) is shifted down for comparison.

