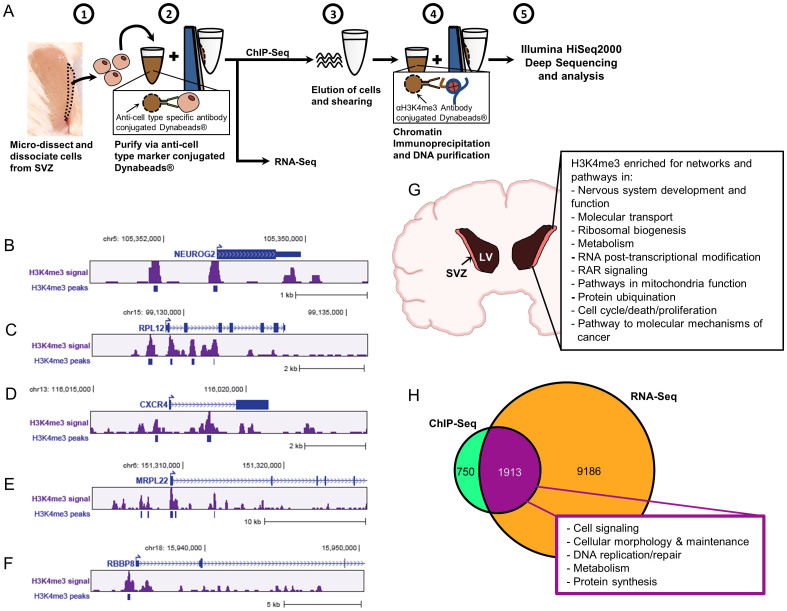
Figure 3. ChIP-Seq and RNA-Seq analyses for in vivo SVZ cells from baboon brain.
(A) Scheme displays purification of the in vivo SVZ cells for ChIP-Seq and RNA-Seq. For ChIP experiments, DCX- and PSA-NCAM-Dynabeads were used for neuroblast purification, GFAP- and Vimentin-Dynabeads were used for NSC purification. For the pool of undifferentiated SVZ cells, Dynabeads conjugated-GFAP, -Vimentin, -Nestin, -DCX, and -PSANCAM were used for purification. (B–F) Peak views of representative genes enriched with H3K4me3 in baboon SVZ cells. The arrows indicate the annotated transcription start sites (TSS). The H3K4me3 signal is “mapped read density” after normalization to unmodified H3. The H3K4me3 peaks were called at FDR0.01, which is derived from a comparison of mapped read enrichment relative to a local background model based on the binomial distribution. (G) For characterization of H3K4me3 enriched genes in baboon SVZ cells, IPA prediction reveals the top canonical pathways and networks under H3K4me3 regulation in the undifferentiated SVZ cells including NSCs and neuroblasts. (H) RNA-Seq analysis uncovers 11099 genes in the undifferentiated SVZ cells are detectable at transcriptional level, while 1913 expressed genes are enriched with H3K4me3 as noted “magenta” portion.

