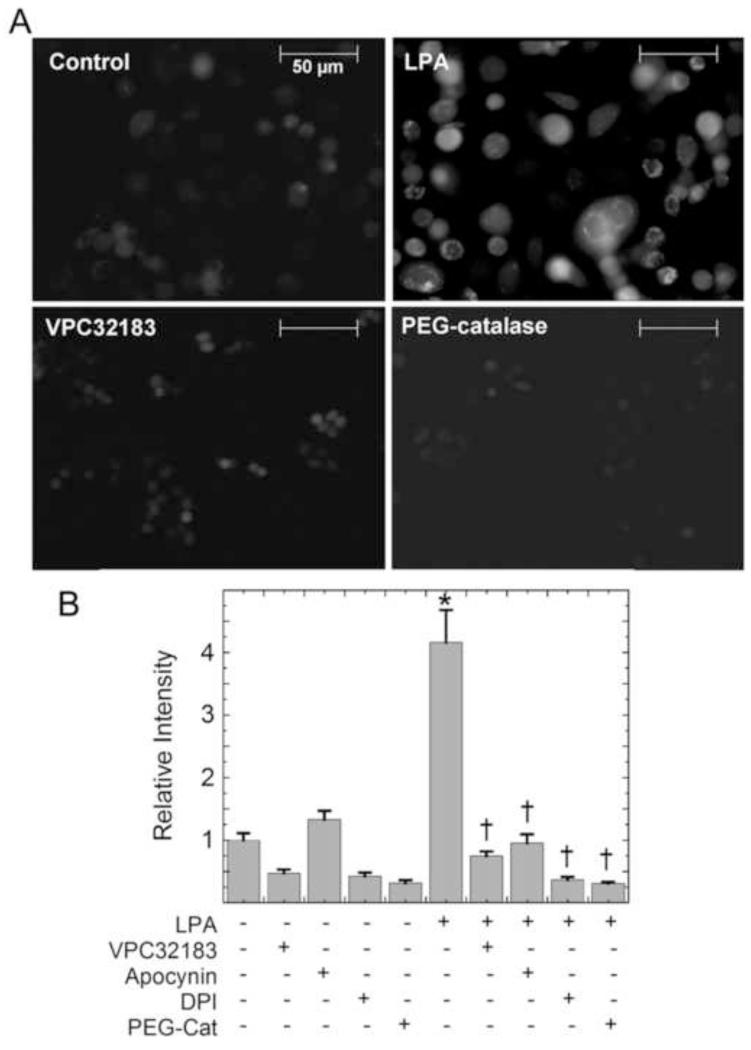
Figure 1.
LPA stimulates NADPH oxidase-dependent production of H2O2 in PC3 cells. (a) PC3 cells were pretreated for 30 minutes with the LPA receptor antagonist VPC32183 (1 μM), apocynin (500 nM), or DPI (1 μM), or overnight with PEG-catalase (400 U/mL), prior to 30 min stimulation with 100 nM alkyl-LPA. Cells were incubated with 50 μM DCFH diacetate for the final 10 min of LPA stimulation, washed, and visualized for DCF fluorescence. Images shown are representative of at least six separate experiments. (b) The relative DCF fluorescence was determined using ImageJ software and averages reflect the total intensity from 3 experiments (n = 48 cells total). The data were then analyzed using one way ANOVA and Tukey’s test for significance. The asterisk indicates the mean is significantly different from the untreated control; daggers indicate means are significantly different from the LPA-treated sample.

