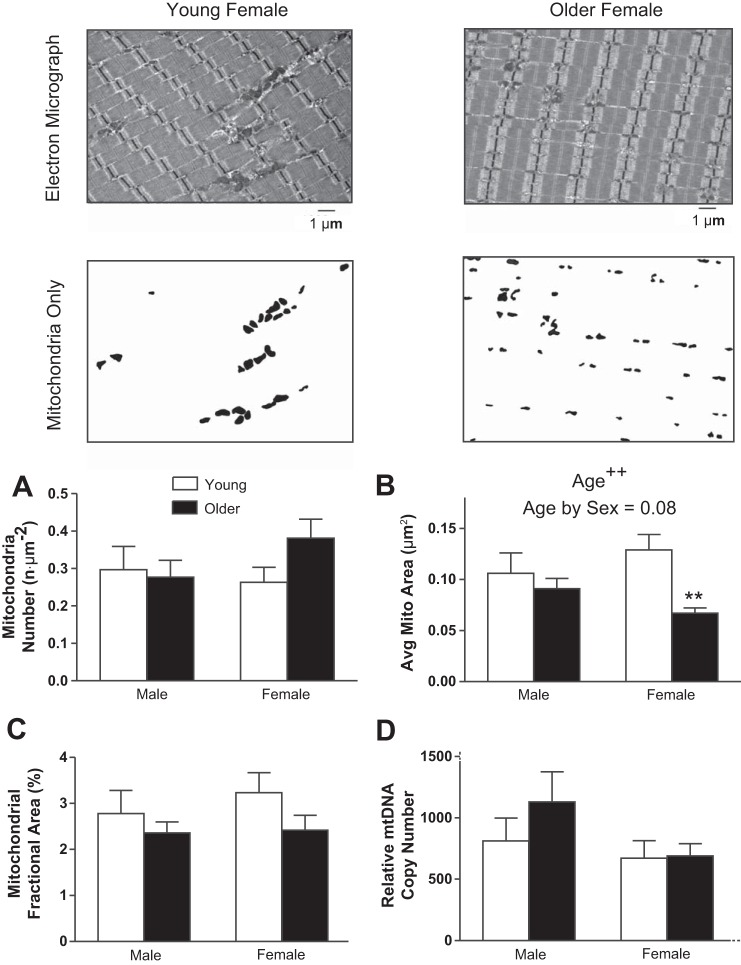
Fig. 4.
Intermyofibrillar mitochondrial fractional area and morphology were assessed using transmission EM. Representative EM images (top) are shown with contrasted versions of the same image below, which were used to identify mitochondrial number (n·μm−2; A), average mitochondrial CSA (μm2; B), and mitochondrial density or fractional area (%field of view; C). D: relative mitochondrial DNA (mtDNA) copy number. Values are means ± SE. Text indicates significant difference (++P < 0.01) between young and older groups (Age) and a trend between age and sex (Age by Sex). **Significant pairwise differences (P < 0.01) between young and older women.

