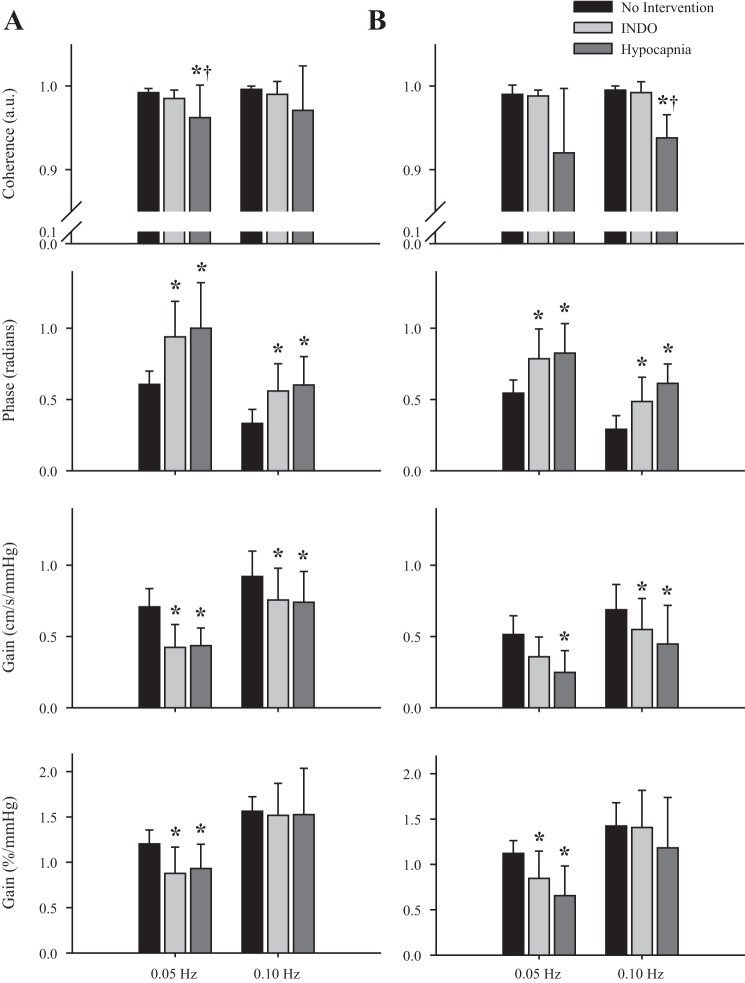
Fig. 4.
Transfer function analysis of coherence (top), phase (middle), and gain (bottom) for the group means of the MCAv-driven (A) and PCAv-driven (B) oscillations during three experimental conditions: no intervention (black), indomethacin (light gray), and hypocapnia (dark gray). *Significance from the no-intervention condition.

