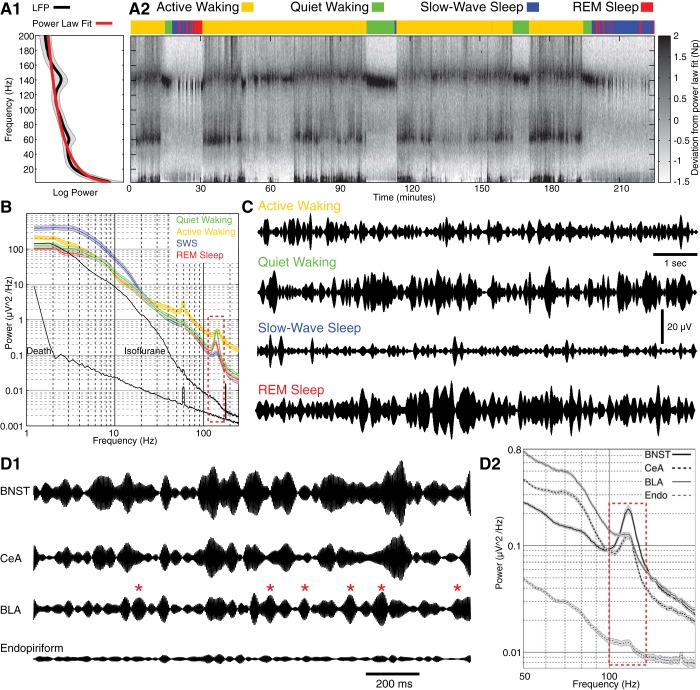
Fig. 2.
State-dependent changes in the spectral composition of local field potentials (LFPs) recorded in BNST. A1: mean spectral power across frequencies for the entire session (black) is fit by a power law (red). A2: deviations from power law fit (grayscale) for different frequencies (y-axis) as a function of time (x-axis). The behavioral state of the rat is color coded (see key at top). B: average ± SE power spectra in different behavioral states. A dashed, red rectangle marks the high-frequency oscillation (HFO) frequency band. For active waking, quiet waking, slow-wave sleep (SWS), and rapid-eye-movement (REM) sleep, the data shown are the averages ± SE of the power spectra of 32 BNST LFPs recorded in 7 rats. For death and anesthesia, we show the average of 9 LFP recordings obtained from 3 rats. C: examples of LFPs recorded in BNST in different behavioral states (band-pass filtered 125–150 Hz). D1: simultaneously recorded LFPs in BNST, CeA, BLA, and endopiriform nucleus (Endo) during quiet waking. LFPs were band-pass filtered at the HFO frequency (125–150 Hz). Note near complete lack of HFOs in Endo and generally lower HFO amplitude in BLA relative to CeA and BNST. Red asterisks mark BLA HFO spindles that had no counterparts in CeA or BNST. D2: power spectra of the LFPs shown in D1. Dashed, red rectangle marks the HFO frequency band and immediately adjacent regions. To compute these power spectra, a long epoch of quiet waking was segmented in 2-s windows, and the data were averaged across windows. Shading represents SE.

