Fig. 3.
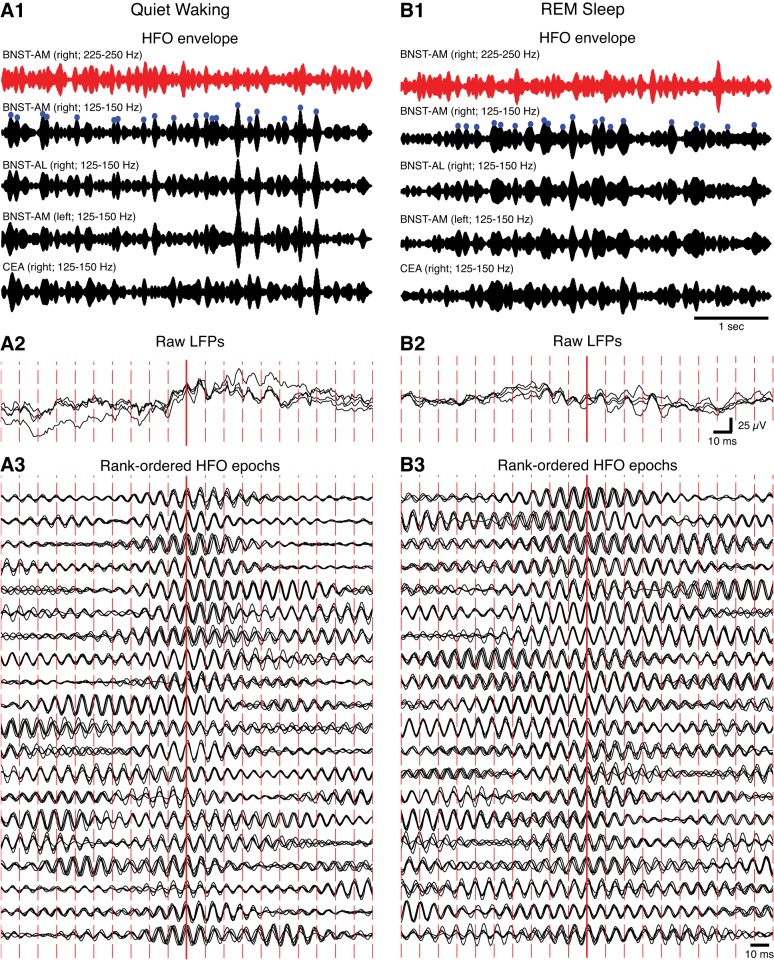
Synchrony of HFOs in BNST and the amygdala during different behavioral states. A: quiet waking. B: REM sleep. 1: Band-pass filtered LFPs from BNST and the CeA (red traces, 225–250 Hz; black traces, 125–150 Hz) shown with a slow time base. Blue circles mark the 20 largest HFO envelope peaks, which are depicted in panels 3 with an expanded time base. Note that high-amplitude HFO spindles (black) were not associated with parallel increases in the power of the 225- to 250-Hz band (red). Thus HFOs do not reflect a nonspecific increase in the power of all high-frequency components. To facilitate within-state comparisons, all signals are normalized by their SD. 2: Raw LFPs with a fast time base. They correspond to the HFO epoch with the highest peak in panel 1. 3: Twenty HFO envelopes marked by blue circles in panels 1 rank-ordered by amplitude (highest to lowest from top to bottom). The signals in each row are normalized by the maximal value found across the 4 traces.

