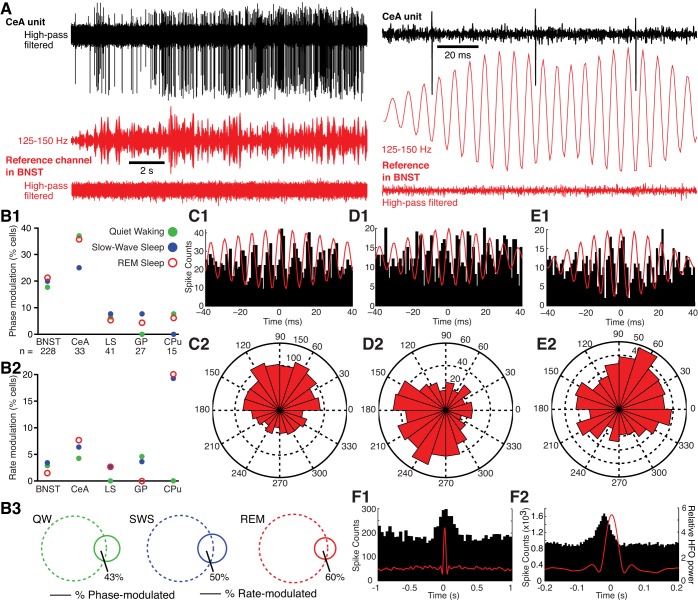
Fig. 6.
A: approach used to study entrainment of unit activity by HFOs. The band-passed (125–150 Hz) LFP recorded by a BNST reference channel (red) devoid of unit activity was used to assess the timing of unit activity in a different channel (CeA; black). From top to bottom: CeA unit activity (high-pass filtered), BNST reference signal band-pass filtered (125–150 Hz; middle), and same signal high-pass filtered (bottom), revealing lack of unit activity. Left, slow time base; right, expanded time base. Note that the gain on reference HFOs was doubled from left to right of A to facilitate inspection of HFO-spike phase relationships. B: incidence of units with significant phase and rate modulation by HFOs in different brain structures and behavioral states. B1: phase modulation. B2: rate modulation. B3: Venn diagrams showing overlap between cells (BNST and CeA combined) with significant phase (dashed lines) and/or rate (continuous lines) modulation by HFOs in QW (left), SWS (middle), and REM sleep (right). Numbers adjacent to areas of overlap indicate proportion of rate-modulated units that are also phase-modulated. LS, lateral septum; GP, globus pallidus; CPu, caudate-putamen. C–E: examples of units that were significantly phase-modulated by HFOs. C1, D1, and E1: peri-HFO histogram of neuronal discharges. To compute these histograms, HFO spindles of high amplitude (top half of the overall distribution) were detected and centered on the positive cycle with the highest amplitude. Unit activity was then referenced to the corresponding HFO spindle. C2, D2, and E2: rose plots of the cells shown in B1, C1, and D1, respectively. Unit in B was recorded in CeA during QW. Unit in C was recorded in BNST in REM sleep. Unit in D was recorded in BNST during QW. F: examples of cells recorded in BNST (F1) or CeA (F2) with significant firing rate modulation by HFOs. To construct these histograms, we computed spike counts (left y-axis; 20-ms bins) in windows (±1 s, x-axis) centered on high-amplitude HFO spindles (≥2 SD of averaged peak values). Right y-axis represents HFO power. To assess entrainment, we referenced unit activity to HFOs from a different tetrode from the 1 used to record the unit and performed a Rayleigh test with a significance threshold of P < 0.01. To assess dependence of firing rate on HFO power, we computed spike counts in windows of ±1 s centered on high-amplitude HFO spindles (≥2 SD of averaged peak values). Then, to assess significance, we performed a Kolmogorov-Smirnov test comparing the actual distribution of spike counts to a uniform distribution for each cell independently (significance threshold of P ≤ 0.01). In addition, we excluded spurious positive results due to baseline modulations in firing rate using a binomial test comparing spike counts between the 2 500- to 1,000-ms intervals flanking HFOs.

