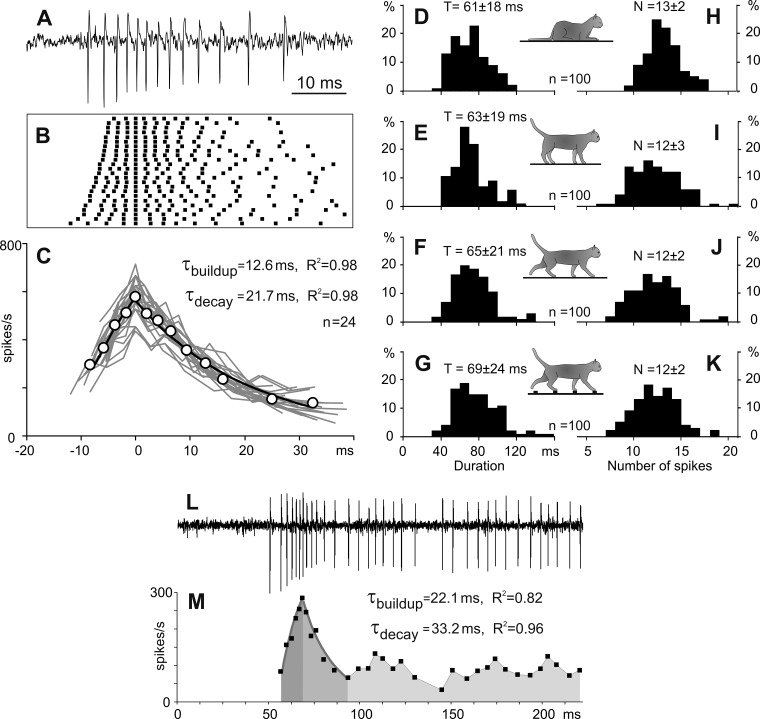
Fig. 1.
The full-scale bursts of spikes in thalamic reticular nucleus (RE) neurons. A: representative full-scale burst recorded from a neuron during sleep. B: raster of spikes composing 24 spontaneous bursts generated by this neuron. C: instantaneous firing rates during each of these bursts (gray lines) and an average instantaneous firing rate (open circles). The buildup and decay of the averaged firing rate are fit with exponents (black lines), for which time constants (τ) and determination coefficients of fits (R2) are indicated. x-Axes in B and C have the same timescale in milliseconds. D–K: histograms of duration (D–G) and number of spikes (H–K) of full-scale bursts recorded during sleep, standing, and walking on the flat surface and on the ladder, correspondingly (the data from randomly selected 100 bursts recorded during each behavior). L and M: a burst occurring at the beginning of an extended period of the firing activity. L: a representative record from a neuron. M: the firing rate of the neuron. Duration of the burst decay was estimated as a time interval with the highest accuracy of the fit. Dark and medium gray areas indicate periods of exponential buildup and decay of the burst, respectively. Time constants and determination coefficients of fits are indicated. The regular firing following the burst is highlighted with light gray.

