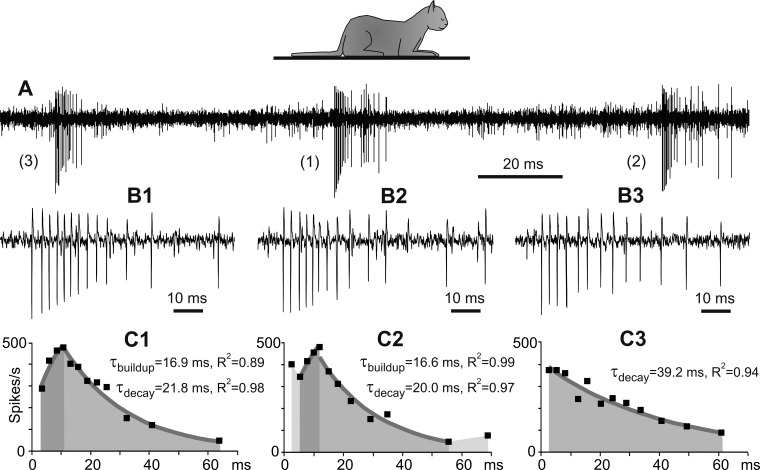
Fig. 2.
Variability in the temporal structure of the burst. A: fragment of a record from a neuron in the sleeping cat. The neuron spontaneously generated three bursts (bursts 1, 2, and 3), which differed in the buildup of the firing rate. B1–B3: the same bursts shown on an expanded timescale. C1–C3: instantaneous firing rates during these bursts (black squares). The buildup and decay of the firing rate are fit with exponents, which are depicted with gray lines. Dark and medium gray areas indicate periods of exponential buildup and decay, respectively. Time constants and determination coefficients of fits are indicated. Changes in the firing rate that preceded and followed exponential buildup and decay are indicated with light gray (C2).

