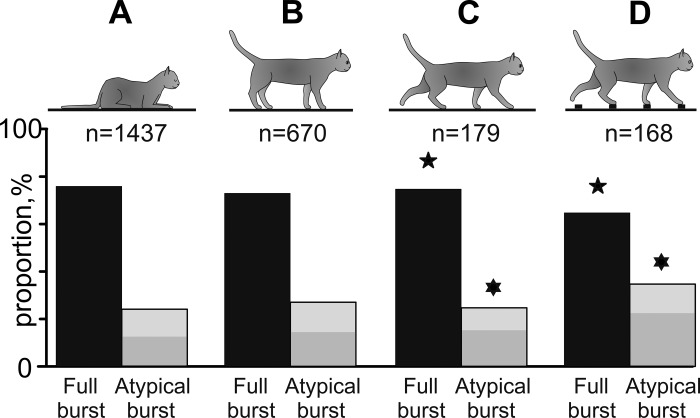
Fig. 3.
Proportions of full-scale and atypical bursts during different behaviors. Silhouettes of cats indicate behaviors. Numbers of bursts used for data analyses during each behavior are indicated. Proportions of full-scale bursts are shown as black bars. Proportions of atypical bursts are shown as gray bars (light gray areas represent altered bursts, and dark gray areas show short bursts). Pairs of data that are statistically different (P < 0.05, t-test) are marked with similar symbols (stars and David stars).

