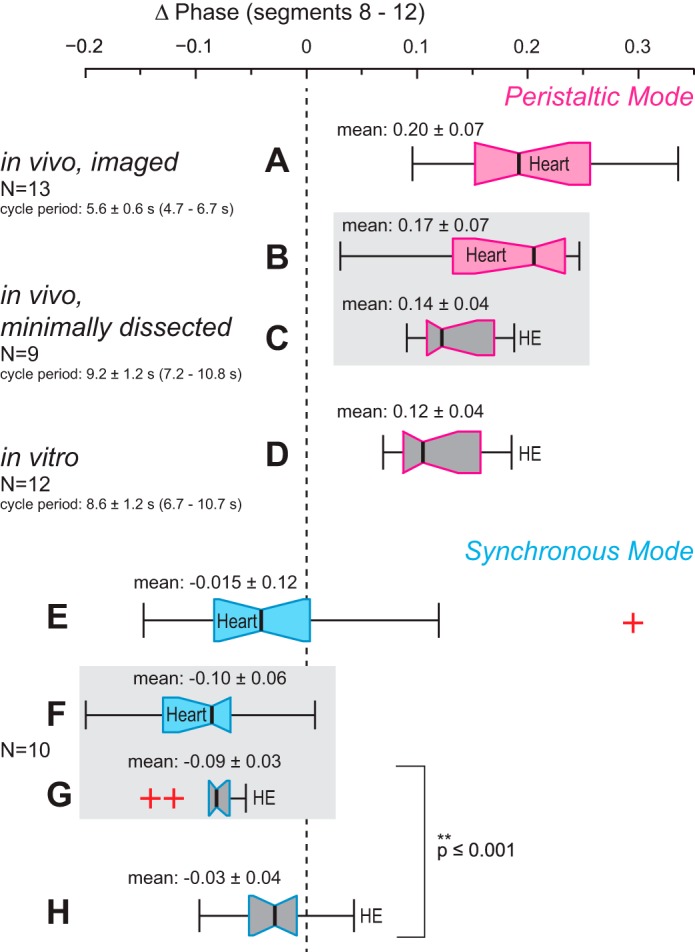
Fig. 12.

Comparison of the data of this study (in vivo) and of recent work in isolated nerve cords (in vitro; Norris et al. 2011). Box-and-whisker plots represent the intersegmental phase differences between bursts in the HE heart motor neurons (phase marker: middle spike) and heart constrictions (phase marker: MRR of constriction) of segments 8 and 12 for the peristaltic mode (top, pink outlines, A–D) and for the synchronous mode (bottom, blue outlines, E–H). Outliers are marked as red crosses. Phase differences between the heart motor neurons of segments 8 and 12 obtained in vitro do not differ from those recorded in vivo in the peristaltic mode (compare C and D) but are different in the synchronous mode (compare G and H). Phase differences between the hearts of segments 8 and 12 do not differ in the 2 in vivo preparations (compare A and B and E and F, respectively). Note that in imaged leeches the synchronous phase progression of heart constrictions matched closely the motor neuron phase progression observed in vitro in both variability and median phase difference (compare E and H). For further details see text.
