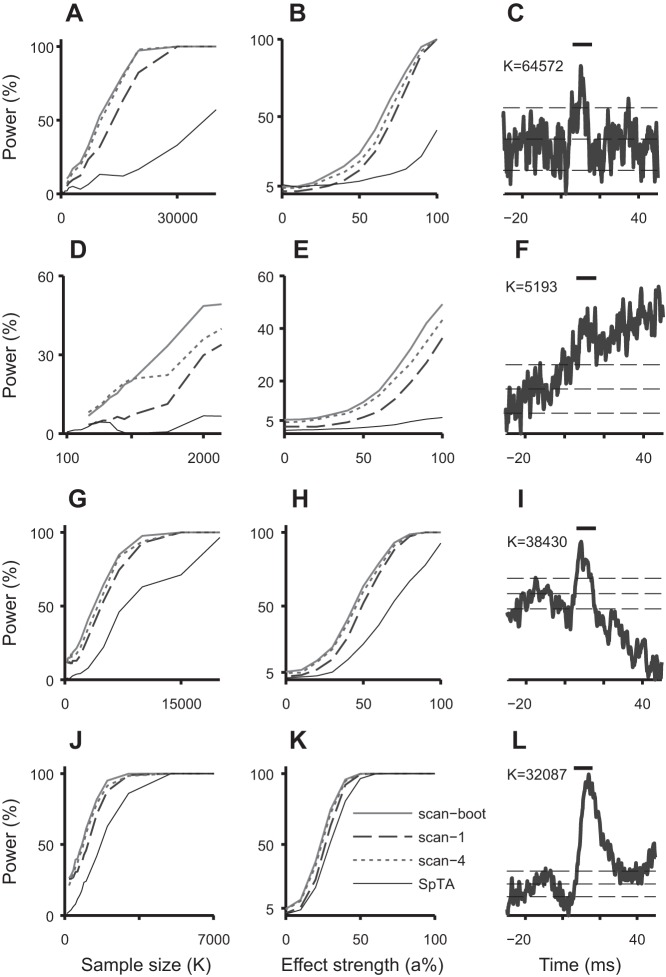
Fig. 3.
Power curves of the scan tests and automatic SpTA inspections as functions of sample size K (A, D, G, and J) and effect strength a (B, E, H, and K) for the parent datasets with SpTAs in C, F, I, and L. C: narrow PSE (PWHM = 3 ms) in a Precision Grip dataset of size 64,572. F: PSE in a Grasp dataset of size 5,193. I: wide PSE (PWHM = 8.4 ms, onset 5.4 ms, offset 15 ms) in a Precision Grip dataset of size 38,430. L: wide late synchrony PSE (PWHM = 9.8 ms, onset 8.6 ms, offset 24.6 ms) in a Digit Flexion dataset of size 32,087. The vertical bars on top span the 6 − 16 ms posttrigger interval. The horizontal lines are at M and M ± 2SD, where M and SD2 are the baseline SpTA mean and variance in the [−20,−10]-ms interval pretrigger. The scan tests are able to detect narrow and wide PSEs, despite using a fixed width 10-ms sliding window. They have uniformly better power than SpTA detection, most notably in small samples (K small) and when the PSE is weak (a small). The bootstrap scan test has better power than the uncorrected test. There are no PSEs in the data when a = 0 in B, E, H, and K, in which case the power is the rate of spurious detections: the bootstrap scan test has the correct rate, the uncorrected test is conservative, and SpTA detection can be very conservative.

