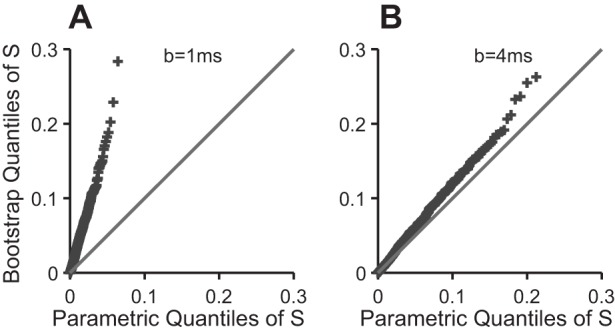
Fig. A1.

Bootstrap diagnostic quantile-quantile (QQ) plot for the scan test. The plot is pathological in A, when the test is scanned every b = 1 ms, which means that the parametric P value (Eq. 5) is biased; a bootstrap P value should be calculated, or the scan step b increased. The plot looks better in B, when the test is scanned every b = 4 ms. The points overlay the line when b ≥ 8 ms (not shown), in which case the parametric P value can be trusted.
