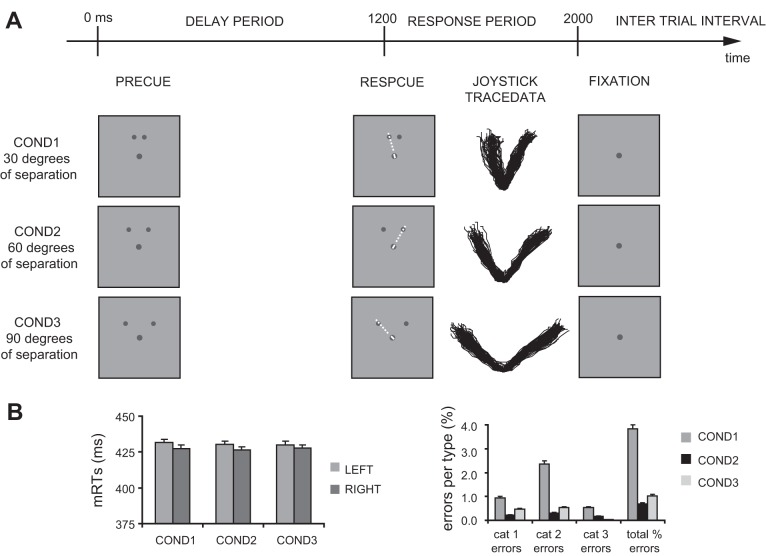
Fig. 1.
Behavioral data. A: at the top, the timeline of a single trial, independent of conditions. Below, an example of stimuli shown in each of the 3 conditions (COND1–3). The dashed white lines between the central cue and 1 of the 2 peripheral target locations in the response cue (RESPCUE) indicate joystick trajectories. Following the onset of the response cue, example joystick traces are shown of 1 participant's correct trials in each condition. B: left histogram shows mean reaction times (mRTs) for all conditions, separately for left and right targets. Right histogram shows corresponding error rates, broken down into the 3 main categories (cat 1: timing and choice errors, cat 2: online corrections, and cat 3: inaccurately targeted responses). Error bars represent SE of the mean.

