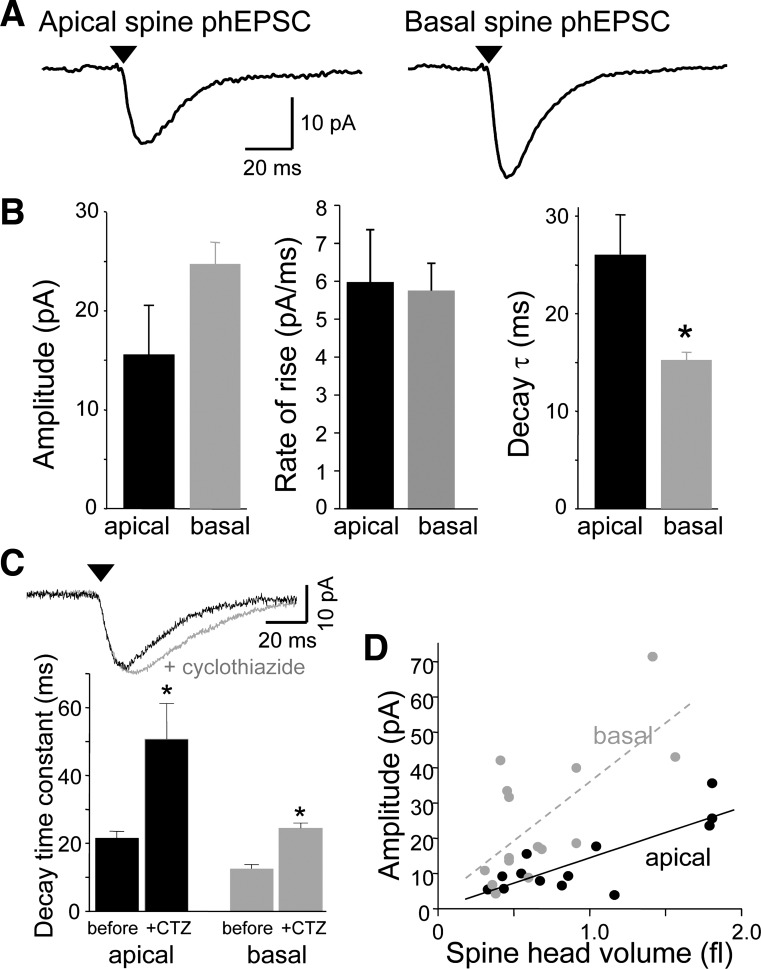
Fig. 4.
Comparison of the basic properties of photolysis-induced EPSCs (phEPSCs) at single dendritic spines on apical and basal dendrites. A: averaged phEPSCs at single apical and dendritic spines. B: mean amplitude, rate of rise, and decay time constant of phEPSCs at apical and basal spines (n = 21, 27 spines). Only the difference in decay time constant was significant (*P < 0.01, unpaired t-tests). C: cyclothiazide (CTZ) prolongs apical and basal spine responses to similar extents. Responses of a basal spine to photostimulation before and after application of CTZ are shown above. Summary data below illustrate that CTZ decreased the decay rate of phEPSCs at both apical and basal spines significantly (*P < 0.05, paired t-test; n = 5, 3). D: the amplitude of responses at individual apical (black) and basal (gray) spines (n = 13, 15 spines, respectively) is plotted as a function of spine head volume. In both cases, the relationship was linear (r = 0.64 and 0.69, respectively). In this and all subsequent figures, arrowhead indicates delivery of UV pulse.

