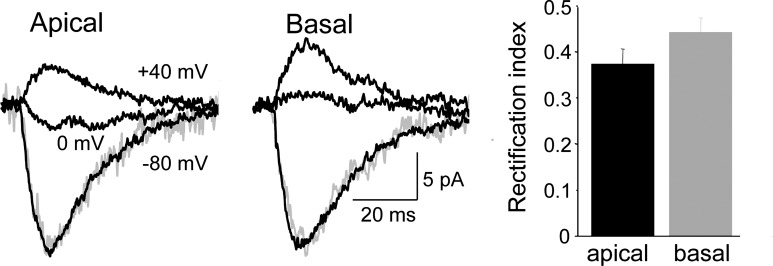
Fig. 5.
Apparent rectification of phEPSCs is comparable at apical and basal spines. Responses of apical and basal spines to photostimulation with the cell voltage-clamped to −80, 0, and +40 mV. The phEPSC at +40 mV was inverted, scaled, and shown in gray superimposed on the phEPSC at −80 mV. The rise and decay rates were not voltage-dependent. Pooled data at right indicate that the rectification ratio was not significantly different in the 2 data sets (unpaired t-test; n = 15, 8 spines).

