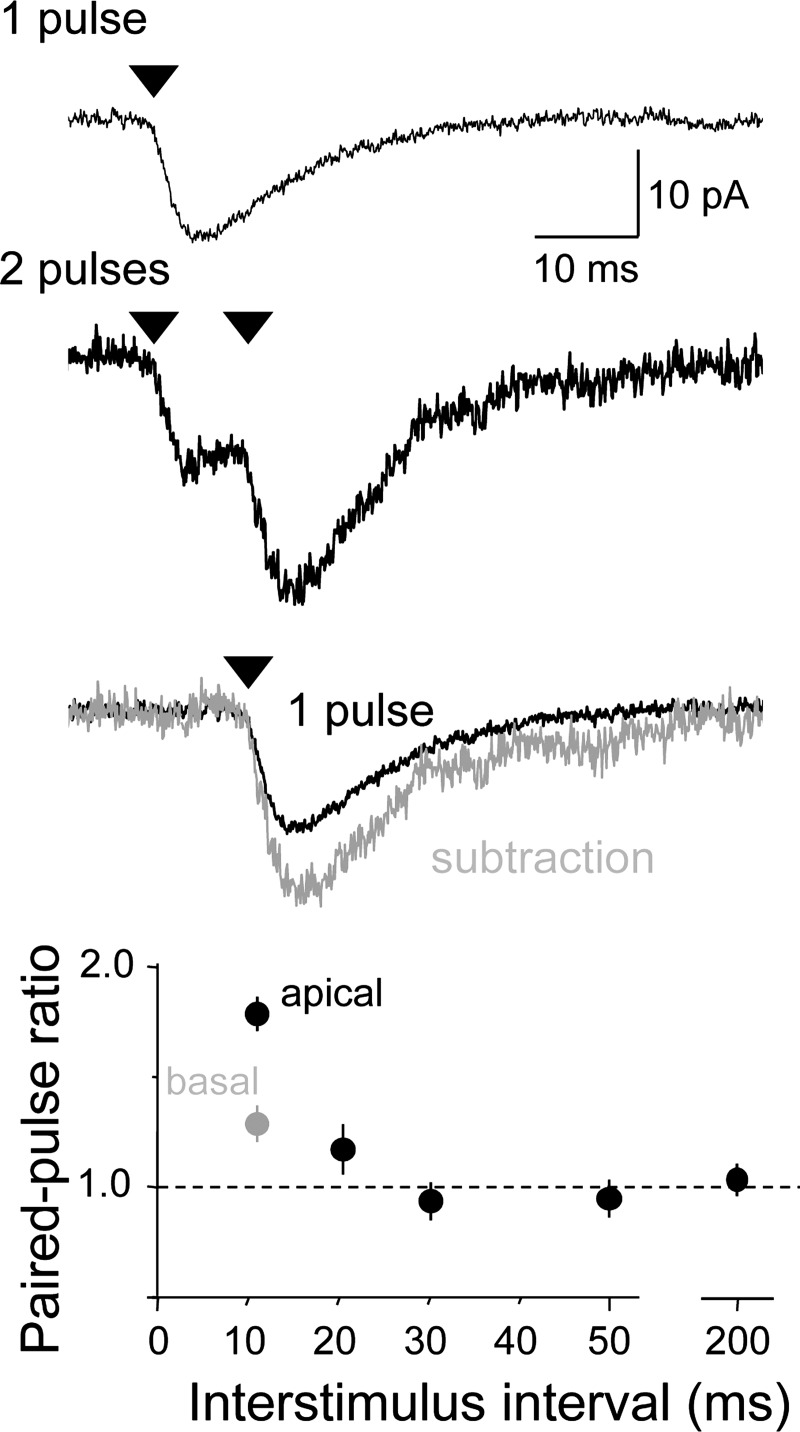
Fig. 6.
Apical spine phEPSCs display significant paired-pulse facilitation (PPF). Responses of a single apical dendritic spine to a single photostimulus (top) or a pair of photostimuli separated by 10 ms (middle). Paired-pulse ratios (PPRs) were calculated in all experiments by digitally subtracting the averaged response to a single stimulus from the averaged response to pairs of stimuli (bottom trace). The PPR was calculated as the amplitude of the isolated 2nd response to the amplitude of the 1st response and is plotted as a function of interstimulus interval for apical (black) and basal (gray) spines below. The PPR of apical and basal spines is significantly different at 10 ms (unpaired t-test, P < 0.001; n = 14, 20 spines, respectively).

