
Fig. 2.
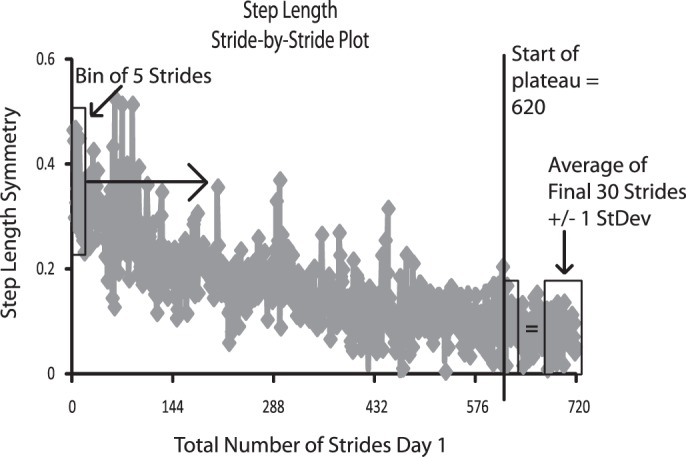
Illustration of rate calculation. First bin of 5 strides is represented by a rectangle at far left. Progressing from left to right in chronological order, the contents of each consecutive bin of 5 strides were compared to the average of the final 30 strides. When 4 of 5 strides in the current bin fell within ±1 SD of the average of the final 30 strides, a plateau was determined to have been achieved. The number of the first stride in this bin was identified as the number of strides of practice required to achieve plateau, which we called the rate of adaptation.