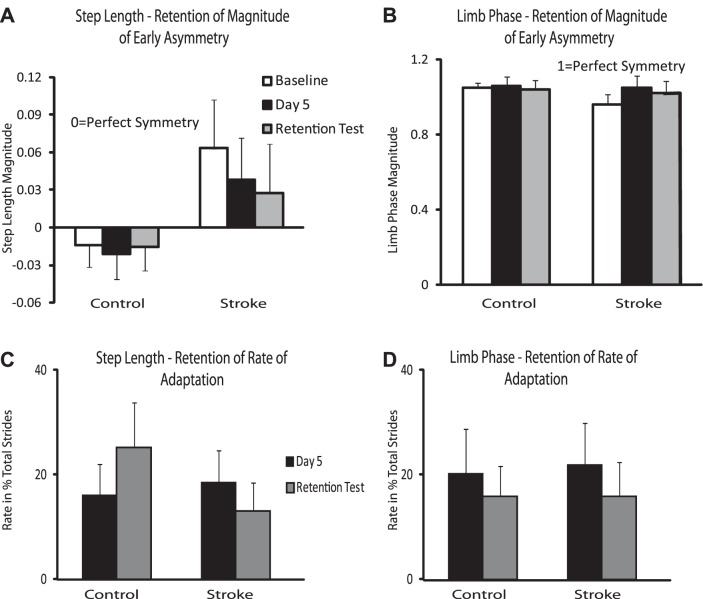
Fig. 6.
Retention of magnitude of early asymmetry and rate of adaptation. A: step length retention of magnitude of early asymmetry. B: limb phase retention of magnitude of early asymmetry. C: step length retention of adaptation rate. D: limb phase retention of adaptation rate. Baseline magnitude is represented by open bars, day 5 magnitude/rate is represented by black bars, and the retention day test is represented by gray bars. Error bars represent SE.

