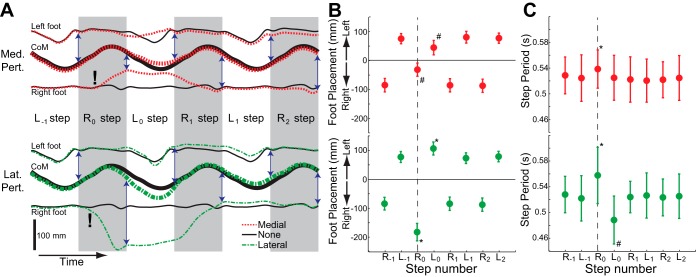
Fig. 4.
Perturbations influenced subsequent spatiotemporal gait characteristics. A: for a single participant, the effects of medial (top) and lateral (bottom) perturbations on the mediolateral locations of the left foot, CoM, and right foot are illustrated over 6 consecutive steps. Each trace illustrates the average response to the (∼20) perturbations delivered during a trial. Exclamation marks (!) indicate the approximate time when perturbations were applied. Right steps are shaded, and the vertical arrows indicate the measured mediolateral foot placements, defined as the mediolateral distance from the CoM to the foot at the time of heel strike. For simplicity, each step is illustrated as having the same duration. B: mediolateral foot placement was predictably influenced by both medial and lateral perturbations. The plotted values correspond to the average lengths of the vertical arrows illustrated in A across all participants. For clarity, left foot placement is plotted as positive while right foot placement is plotted as negative. C: step period was affected by medial and lateral perturbations, as the perturbed step consistently had a longer step period. For B and C, the vertical dashed line indicates the perturbed right step (R0), in which the foot is moved either medially or laterally during swing. For each participant, we calculated the average values for these gait spatiotemporal metrics preceding and following the applied perturbations. Here, the dot locations indicate mean values and the error bars represent SDs of these values across all 10 participants. *Magnitude significantly greater than steady state, #magnitude significantly less than steady state (P < 0.05; post hoc t-tests).

