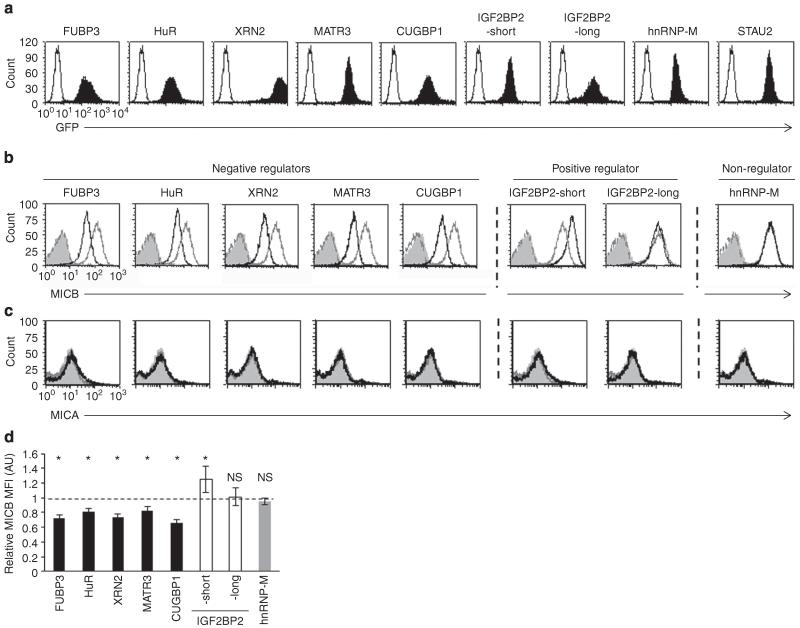
Figure 4. Overexpression of the identified RBPs alters the surface expression of MICB.
(a) Green fluorescent protein (GFP) levels of RKO cells transduced with the various indicated RBPs. The empty black histogram represents background autofluorescence, the filled black histogram represents GFP expression after transduction. (b,c) FACS analysis of the expression of MICB (b) and of MICA (c) on RKO cells transduced with the indicated RBP. The empty black histogram represents the indicated RBP (gated on GFP+ cells), the empty grey histogram represents the control RBP (STAU2). The dashed dark grey histogram represents background of the indicated RBP and the filled grey histogram represents background staining of STAU2 cells. (d) Quantification of the effect of the various RBPs on the levels of MICB in RKO cells. Shown is the relative average MFI of MICB ± s.d. from six independent experiments calculated relative to the average MFI by STAU2-transduced RKO cells (set as 1). *P<0.05, by paired Student’s t-test, NS, not significant.

