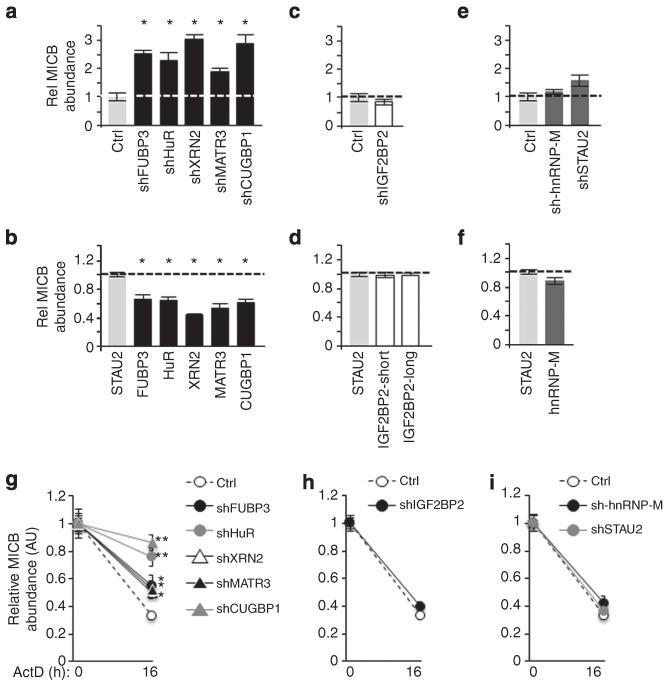
Figure 6. Mechanism of RBP-mediated regulation of MICB expression.
Relative mRNA abundance of MICB in RKO cells transduced with various shRNAs (a,c,e) or RBPs (b,d,f) was evaluated by qRT-PCR. hGAPDH was used as a reference gene. Shown are mean ± s.e.m. of triplicates. Data are representative of three independent experiments. (a,c,e) The abundance of MICB in cells transduced with a control-shRNA was set as 1. (b,d,f) The abundance of MICB in cells transduced with STAU2 was set as 1. *P<0.05, by paired Students t-test. (g-i) Relative mRNA abundance of MICB in the shRNA-transduced RKO cells treated with ActD was evaluated by qRT-PCR. The abundance of MICB in each RBP-KD cell at time 0 was set as 1. The hGAPDH was used as a reference gene. Shown are mean ± s.e.m. of triplicates. Data are representative of three independent experiments. *P<0.02, **P<0.002 by Students t-test.

