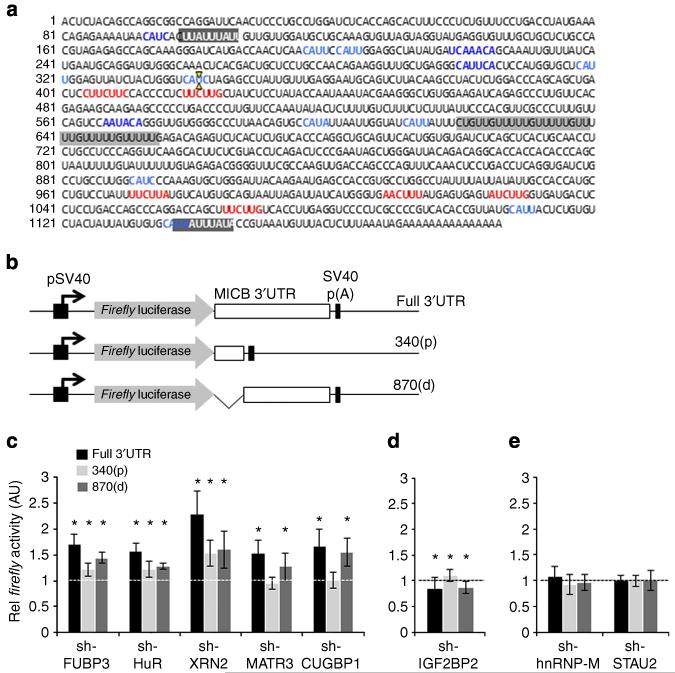
Figure 7. Binding regions of the MICB-targeting RBPs in the 3′UTR of MICB.
(a) The sequence of the 3′UTR of MICB. Highlighted are potential RBP-binding elements. AU-rich elements (possible HuR-binding regions) are highlighted in dark grey and white letters. A GU-rich element (possible CUGBP1-binding region) is highlighted in dark grey. MATR3 consensus-binding sequences are marked in red. IGF2BP2 consensus binding sequences are marked in blue. The XbaI restriction site was used to generate two UTR fragments, and is marked by two yellow arrows. (b) Schematic description of the Firefly luciferase constructs used. An SV40 promoter (black arrow) drives the expression of the Firefly luciferase (grey arrow), which is fused either to the full-length 3′UTR of MICB (‘full 3′UTR’, top), to the proximal 340 bp of the 3′UTR (‘340(p)’, middle), or to the distal 870 bp of the 3′UTR (‘870(d)’, bottom). (c-e) The three Firefly reporters were transfected into RKO cells transduced with the various shRNAs (indicated on the x axis). Forty-eight hours post transfection, Firefly activity was measured relative to the Renilla luciferase. The Firefly/Renilla activity ratio was normalized to the ratio in the control-shRNA-transduced cells, which was set to 1. Shown is averaged mean ± s.d. of combined six independent experiments. *P<0.05, by Student’s t-test. White/black line represents the one threshold.

