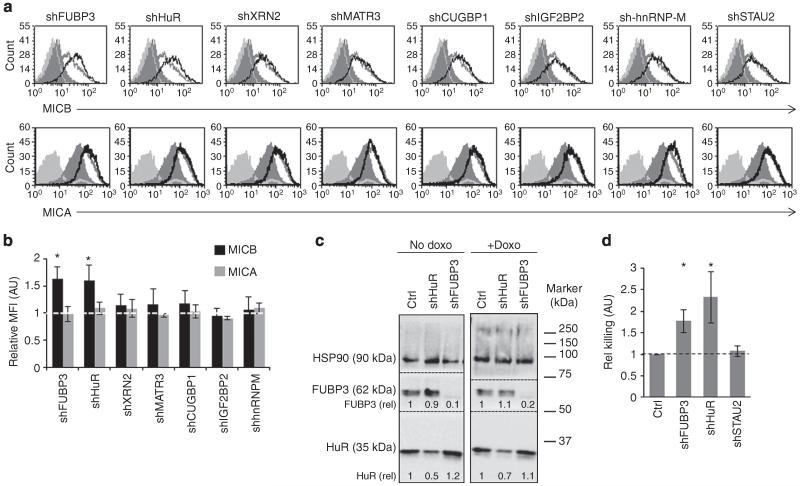
Figure 9. FUBP3 and HuR regulate MICB expression during DNA damage.
(a) FACS analysis of the expression of MICB (top) and MICA (bottom) on shRNA-transduced HFF cells prior (filled dark grey histogram) and following (empty grey/black histograms) doxorubicin treatment. The empty black histogram represents the specific shRNA-transduced HFF cells-treated cells (indicated above the histogram), the empty grey histogram represents control-shRNA-treated cells. The filled light grey histogram represents background staining. Data are representative of four independent experiments. (b) Quantification of all independent experiments performed in (a). Shown is the average MFI ± s.d. relative to control-shRNA doxorubicin-treated HFF cells of all experiments. *P<0.005, by Student’s t-test. (c) WB validation of FUBP3 and HuR-KD efficiency prior and following doxorubicin treatment (no Doxo and + Doxo, respectively). HSP90 served as a loading control. After blot transfer, the nitrocellulose membrane was cut, according to the molecular weight of HuR, FUBP3 and HSP90. Each membrane strip (borders indicated by the black dotted lines) was incubated with the respective primary antibody. (d) NK killing assay was performed on the indicated shRNA-transduced HFF cells (x axis) following doxorubicin treatment. Shown is the relative average killing ± s.d. of three independent experiments. Relative killing was calculated relative to the killing of control-shRNA-transduced HFF cells. *P<0.005 by Student’s t-test.

