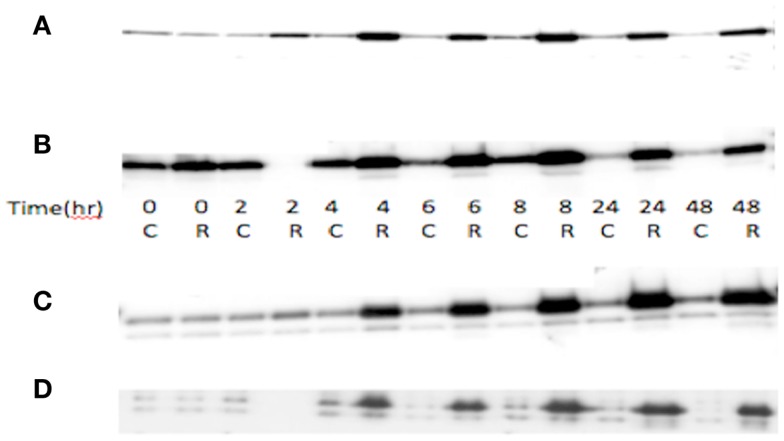
Figure 1.
TP53 and p21 protein expression in radiated (R) vs. control (C) in A2780 cell line. (A) Wild-type A2780 cell line shows increased TP53 expression in radiated vs. control samples. (B) TP53 mutant A2780 cell line with induction of TP53 expression in radiated vs. control samples. TP53 protein expression increase seen at 4 h, with greatest increase at 6–8 h, and induction sustained to 48 h. (C) p21 protein expression in wild-type cells. Increased expression noted at 4 h and sustained to 48 h. (D) p21 expression in TP53 mutant cell line. Induction of expression noted at 4 h, sustained to 48 h.

