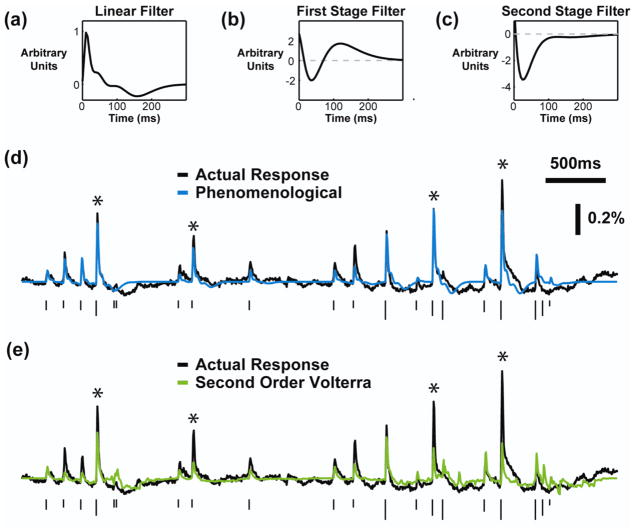
Figure 4. Phenomenological model based on experimental observations accurately predicted the cortical response to patterned microstimulation.
The average (a) linear kernel, (b) first stage feedback kernel, and (c) second stage feedback kernel of the phenomenological model fit on Poisson train stimuli and VSDI response data (N=7). In each case, the first stage kernel implemented the facilitation dynamics and the second stage implemented the suppression dynamics. (d) An example of the performance of the phenomenological model (blue), with the actual response shown in black. (e) An example of the second order Volterra model performance (green), with the actual response shown in black. In (d) and (e), the height of the ticks indicates the current intensity and the asterisks mark stimuli for which the Volterra model severely under-predicted the response. The phenomenological model performed better for these responses.

