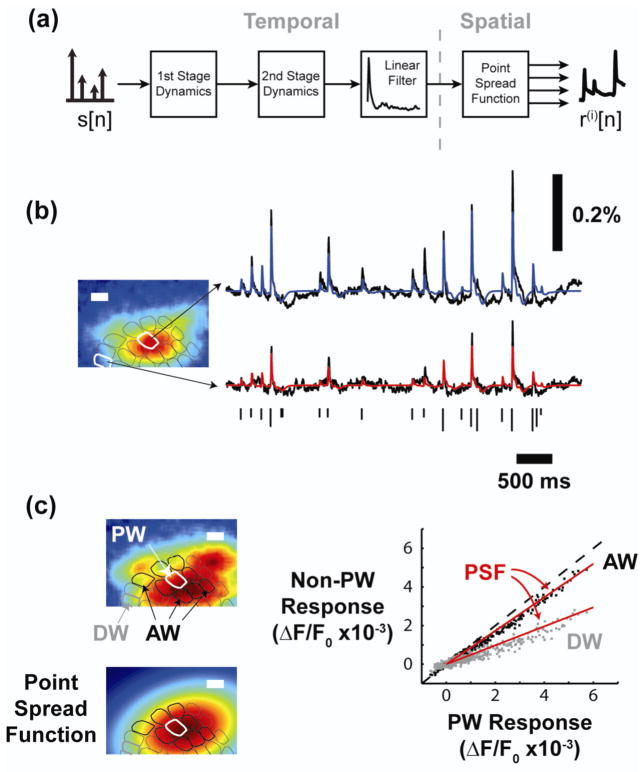
Figure 6. Extension of phenomenological model captures spatial spread.
(a) A linear point spread function, modeled as a two dimensional Gaussian, was used to extend the model spatially across all cortical columns. (b) The spatial extension to the model captured the dynamics for the principal cortical column as well as distant cortical columns. (c) A representative cortical response (top left) and the point spread function (bottom left) were similar. In the scatter plot, the point spread function (red) captures the relative response properties of the principal cortical column and adjacent cortical column for neighboring (black) and distant (gray) cortical columns. Each data point indicates the response to a single impulse within the RAP impulse train. Scale bars in (b) and (c) are 500 micrometers.

