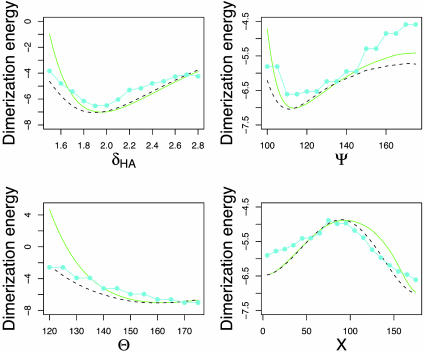
Fig. 3.
Formamide dimer hydrogen bonding energies (kcal/mol) vs. δHA (Å), Ψ, θ, and X (°). Green (solid), DFT (same as in Fig. 2); black (dashes), DFT with constrained optimization; cyan (solid with filled circles), knowledge-based potential (negative logarithm of frequency distributions for side-chain–side-chain interactions in protein structures, binned as described in Methods).

