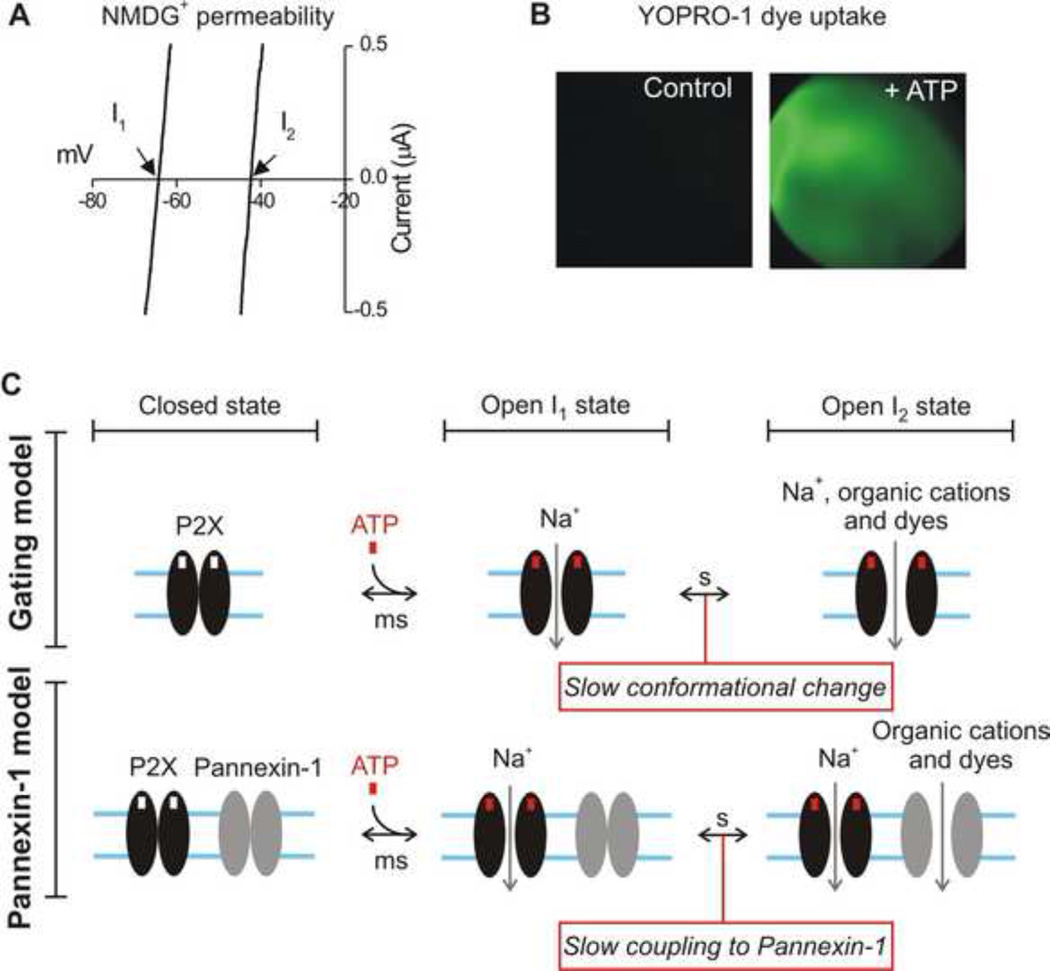
Figure 4. Examples and models of slow conformational changes in P2X receptors displaying pore dilation.
A. Current-voltage plots for example recordings of the I1 and I2 states for P2X2 receptors expressed in Xenopus oocytes are shown. The I1 state has low permeability to the organic cation NMDG+ (hence a negative reversal potential). With time the permeability to NMDG+ increases, indicated as a shift in reversal potential by ~ +16 mV. B. Representative images of a Xenopus oocyte bathed in YOPRO-1 before and during 100 µM ATP (for 30s). The oocyte becomes fluorescent as YOPRO-1 enters the cell, presumably via the I2 state. The data shown in A and B are from Supplementary information accompanying (Chaumont and Khakh, 2008). C. Diagrams illustrating the differences between the Panx-1 and gating models for the I2 state. In the gating model, small cations, organic cations and dyes enter due to slow conformational changes in the P2X pore. In the Panx-1 model, organic cations and dyes enter via an accessory ion channel protein called Panx-1. On balance the field is converging on the gating model, but there is also evidence for the Panx-1 model in the case of P2X7 receptors that are natively expressed (as discussed in the main text). In both models, the cytosolic domains of P2X receptors are important.

