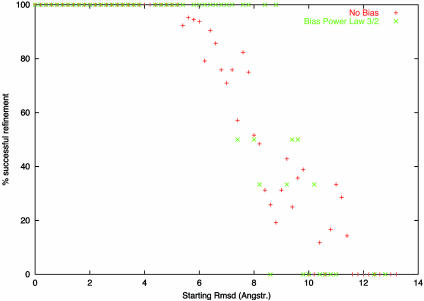
Fig. 1.
Refinement with respect to the 10 lowest-frequency normal mode amplitudes: proportion of models refined to better than 0.5 Å, as a function of the initial rmsd. To investigate the influence of normal mode concentration, a weighting scheme cl/l3/2 that most closely matches the observed one in the PDB was also used, showing a much sharper transition around 8 Å.

