Figure 3.

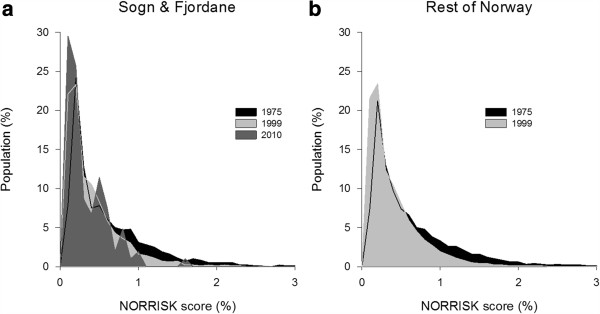
The NORRISK score. The distribution of total CVD risk (%) in (a) Sogn & Fjordane 1975-2010 and (b) the rest of Norway 1975-1999.

The NORRISK score. The distribution of total CVD risk (%) in (a) Sogn & Fjordane 1975-2010 and (b) the rest of Norway 1975-1999.